Is Your SOC Actually Doing Anything? Here Is How to Find Out

All right class.
A friend of mine recently took over a security engineering position. The company had a managed SOC on a five year contract, three years into it. He rang me and said he had not really heard anything from the provider in weeks. The Sentinel queue looked suspiciously quiet. He wanted to know what to actually check before he walked into a review meeting with them.
What we found was not pretty. This post exists so you find the same things before you waste another year paying for a service that is running on autopilot.
Start With Yourself, Not With Them
Before you open Sentinel, answer this question honestly.
Do you know your own environment? How many servers are you running? Are you using Azure Arc? Where are your domain controllers? On-premises SQL or Azure SQL? Azure Firewall, on-prem firewalls, or both? Any AWS, GCP, or Google Workspace?
My friend knew his environment reasonably well. That mattered. If you do not know what you have, you cannot tell whether it is being monitored. That is step zero.
If you cannot answer those questions without having to go look for thirty minutes, fix that first. The SOC evaluation conversation starts from a position of strength, not uncertainty.
The Analytics Rules Check Nobody Does Until It Is Too Late
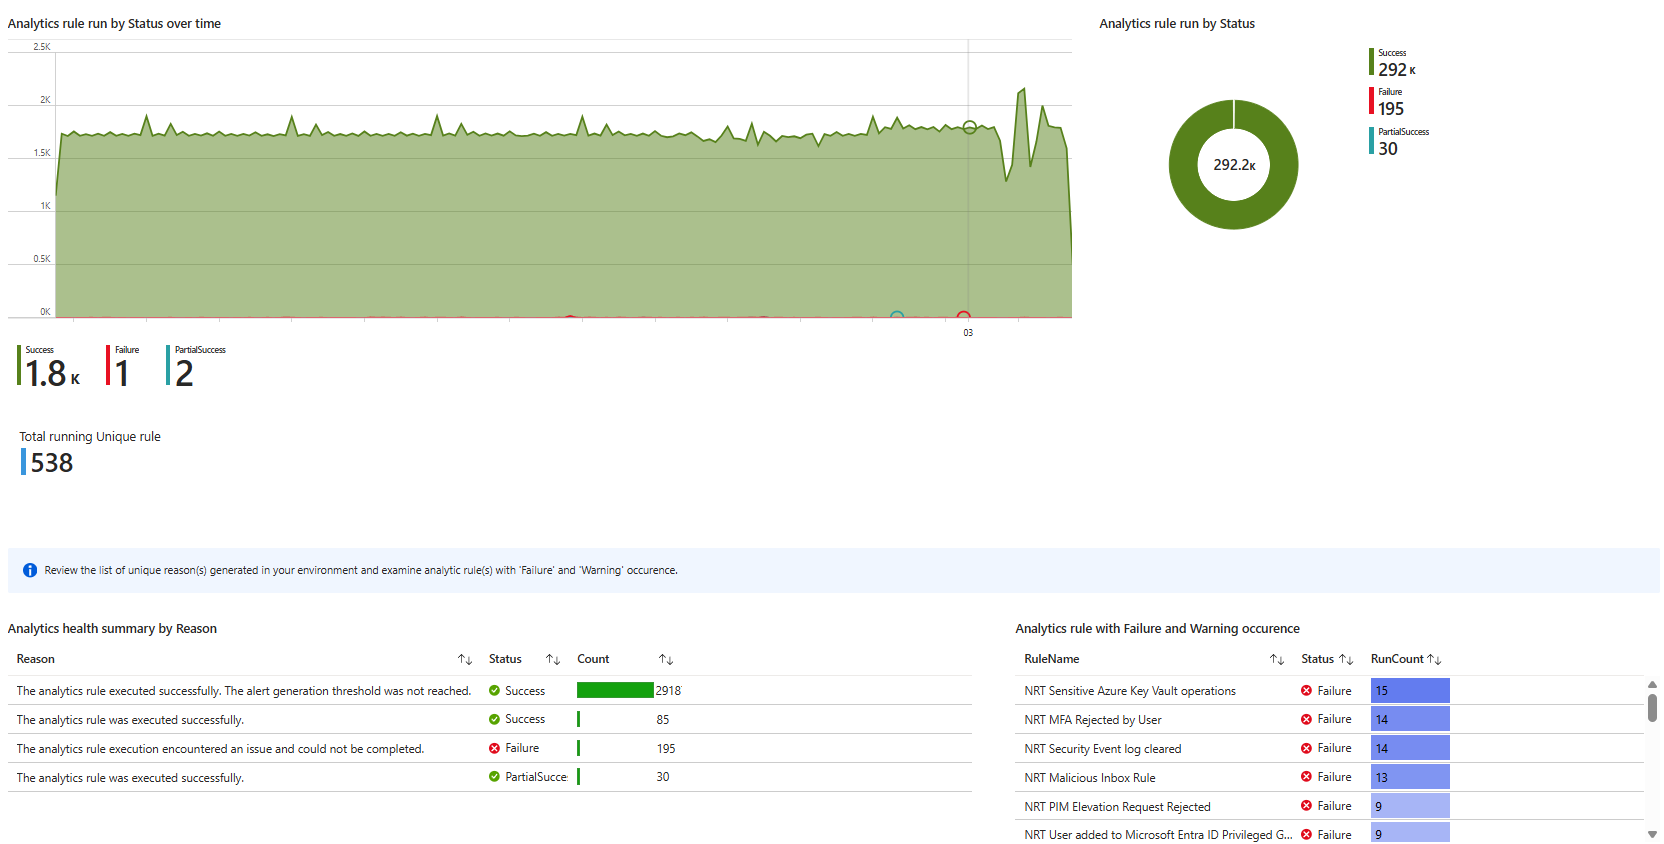
Open Sentinel. Go to Analytics. Look at how many rules exist, how many are enabled, how many are disabled, and when each one was last modified.
That last modified date is where the bodies are buried.
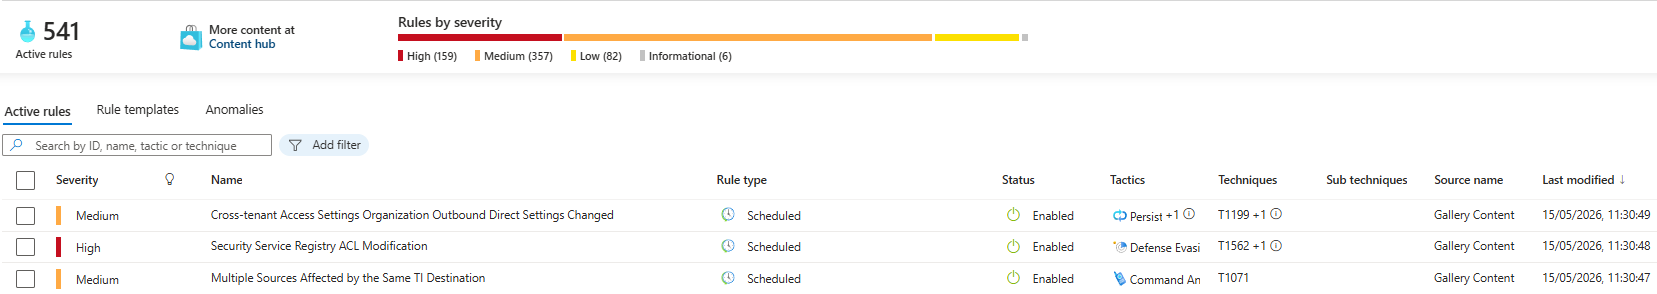
Every single rule in my friend's environment had a last modified date of 2024. Two full years of zero detection engineering. No new rules. No updates. No new threat intelligence rules using the updated ThreatIntelIndicators schema. Nothing.
Ask your provider: When did you last write a new analytics rule for our environment? Why are those rules disabled? When did you last update an existing one? What triggered that change?
If they have to think hard before answering, you have your answer.
Data Connectors: Connected Does Not Mean Configured
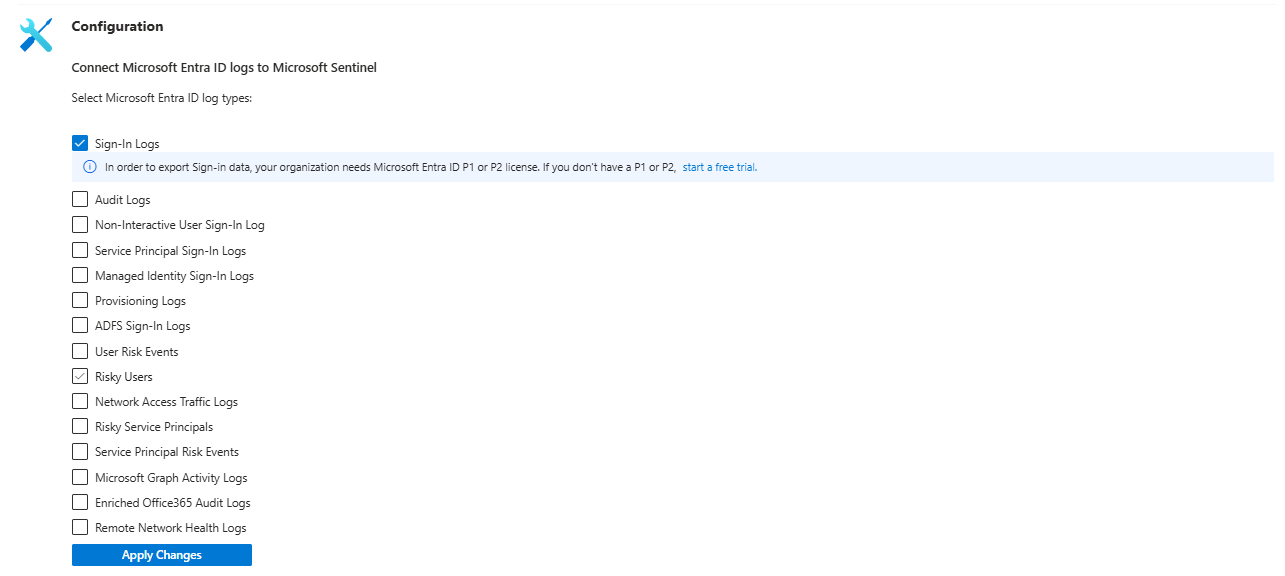
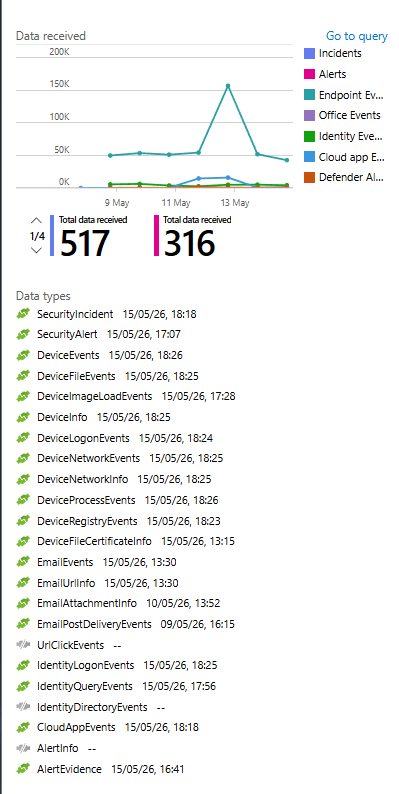
Go to Settings > Data Connectors. Filter by connected. Now click into each one and look at which tables are actually flowing.

The Entra ID connector was pulling SigninLogs but had never been configured to pull AADNonInteractiveUserSignInLogs or AADServicePrincipalSignInLogs. Those two tables are where token abuse, service principal anomalies, and non-interactive authentication patterns live. They were simply not there. Nobody had reviewed the connector configuration since the contract started.
The Microsoft Defender XDR connector was missing DeviceFileEvents and DeviceNetworkEvents. The SOC later told him they had the endpoint data in XDR. Great. But because those tables were not flowing into Sentinel, zero detection rules could run against them.
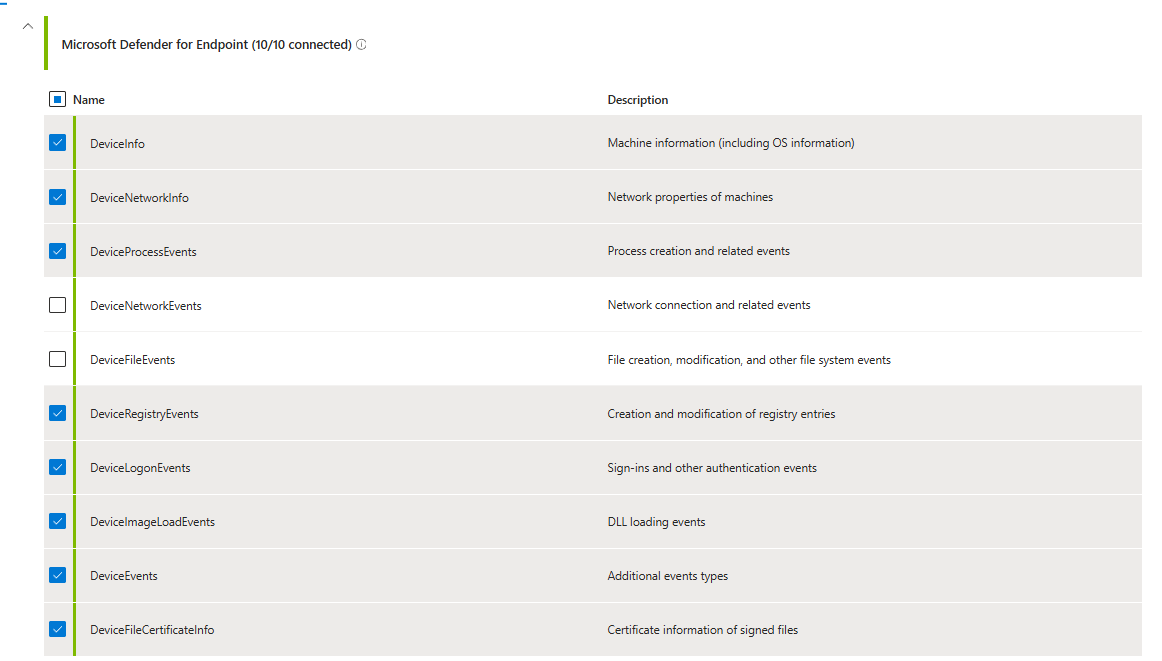
When was the last time someone reviewed the data connector configuration? Onboarding day. Never touched again.
To defend some of the companies out there - this could be of course a contractual agreement, and there is nothing wrong with. From the experience - it's not.
It's mainly due to a lack of correct communication on how useful those logs may be, a lack of detections, or a cost optimzation type of thing, where you are cutting down tables considered as noise (I could write a book about this single topic alone and push back then why not use Data Lake, splitting the rules, using tools like Cribl, etc)
Connected status at the top of the connector page means nothing if the individual tables inside that connector were never enabled. Check the actual tables, not the connector status.
Workbooks: Five of Them, None of Them Useful
There were five workbooks deployed. All from Content Hub solutions. Zero custom builds, and this itself doesn't mean that there is something wrong with it, some of the workbooks found in the content hub are genuinely amazing but..
Three of them covered firewall inbound and outbound connections. Different versions of the same thing. Nothing showing incident statistics, detection coverage over time, ingestion costs, analytics rule health, or any metric you would actually want to track.
Last updated? Two years ago. Same as everything else.
A working SOC deployment has workbooks (or other type of the reporting) that tell you what you cannot see at a glance. Ingestion by table. Incident volume and closure rates by week. Analytics rule coverage against your data sources. Usage. Comparisons between this and last month. None of that existed.
It's always worth having a conversation with your SOC provider about what they are providing and if they can provide anything based on your specific requirements.
Automation Rules: Silent Decisions Nobody Approved
Check your automation rules under Automation. Some were sensible. Severity changes. Tags. Routing incidents correctly.
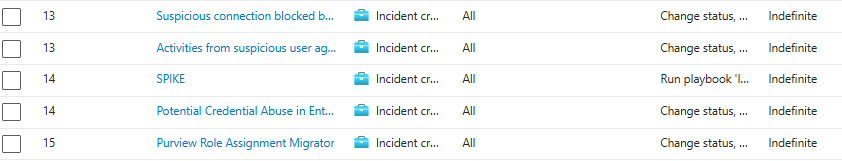
Two rules were auto-closing specific incidents based on a username and an IP address. Set to indefinite. No review date. No documentation.
When my friend asked whether there was any change control around those rules, the answer was no. The SOC had decided on their own that certain alerts were noise and had been silently suppressing them. No record. No approval. No expiry. Just a permanent close set and forgotten.
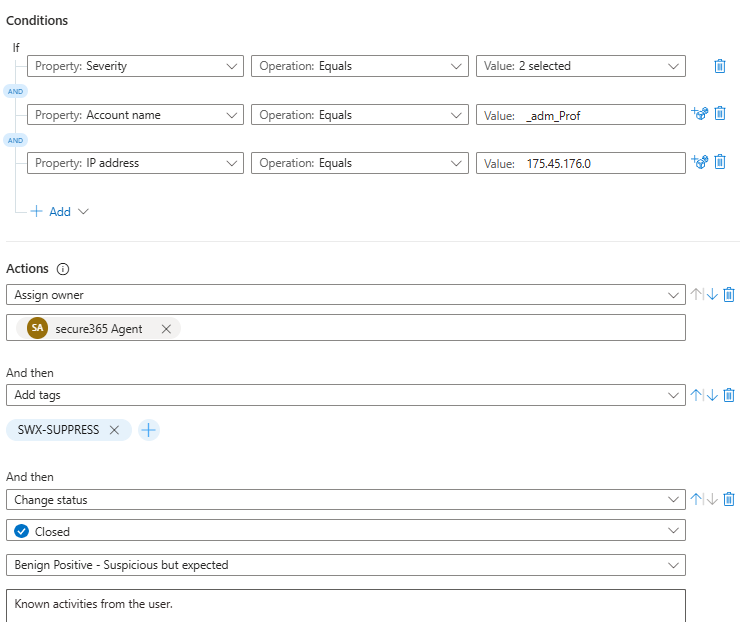
If that username changes roles or that IP gets reassigned to something malicious, you will never know. The rule will keep closing every incident that matches.
Every auto-close or suppression rule needs a justification and an end date. If yours do not have those, that is the first conversation.
Diagnostic Settings: Logs Nobody Collected
Azure Diagnostic Settings across resources and subscription level were completely untouched.
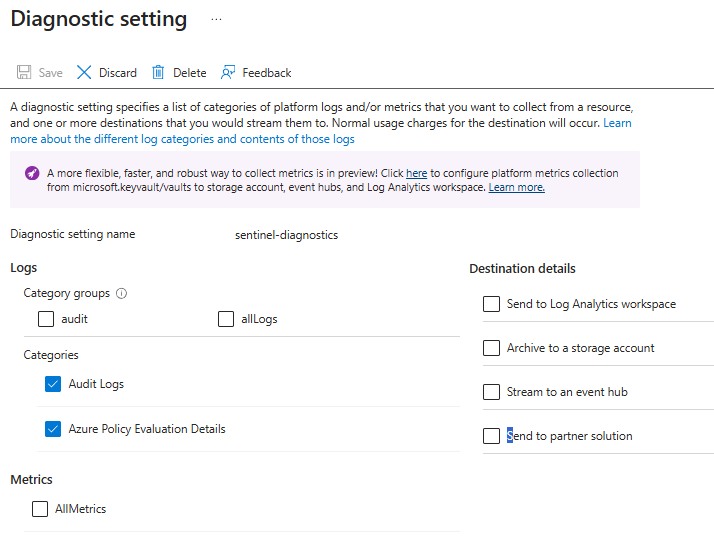
No NSG flow logs. No Key Vault audit logs. No Azure Activity logs for privileged control plane operations. No resource-level diagnostics sending to the workspace.
Key Vault access logs tell you who accessed what secret and when. NSG flow logs show every allowed and denied network connection. Activity logs give you the full picture of who did what across your Azure infrastructure.
None of it was being collected. Nobody had touched diagnostic settings since the contract started.
If you have resources in Azure and have not configured diagnostic settings, you have blind spots in your cloud environment regardless of how many endpoint agents are deployed.
Defender Products: Ask the Uncomfortable Questions
Work through each product. For each one, ask the same two questions: is it configured correctly, and who is actively reviewing it?
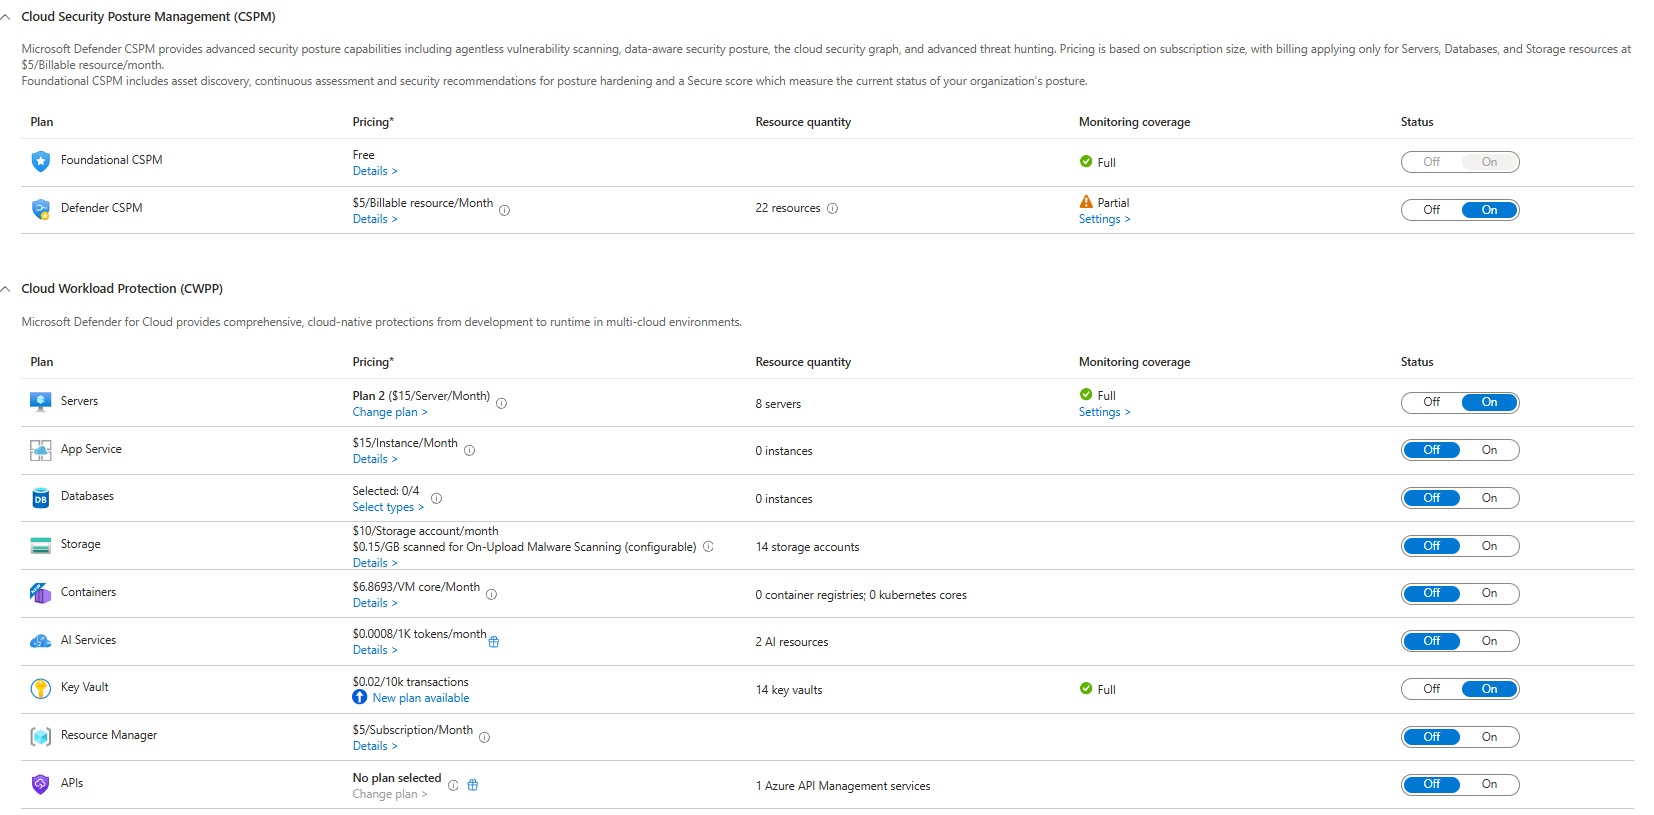
Defender for Cloud: Are any Defender plans enabled? If plans are off, is there a documented reason why? If it is enabled, do you have any plan in place to review recommendations and actually act on them?
Defender for Cloud Apps: Do you have policies enabled? Is anyone reviewing discovered apps? Is your provider helping you sanction and unsanction applications?
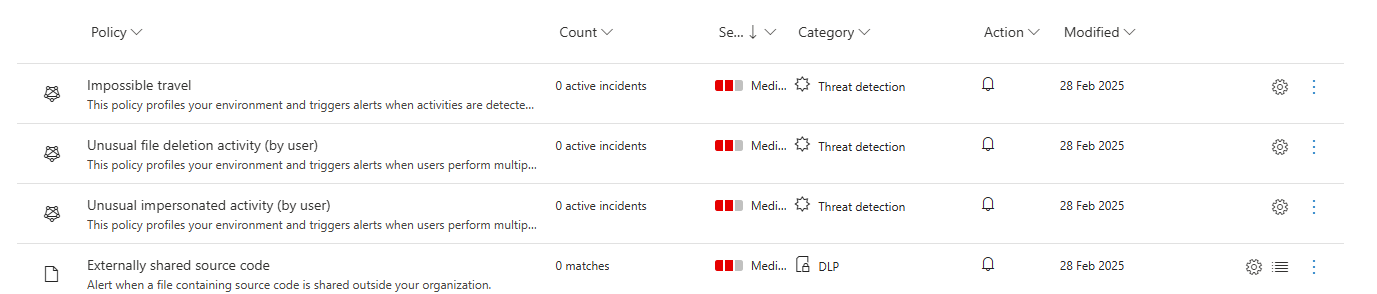
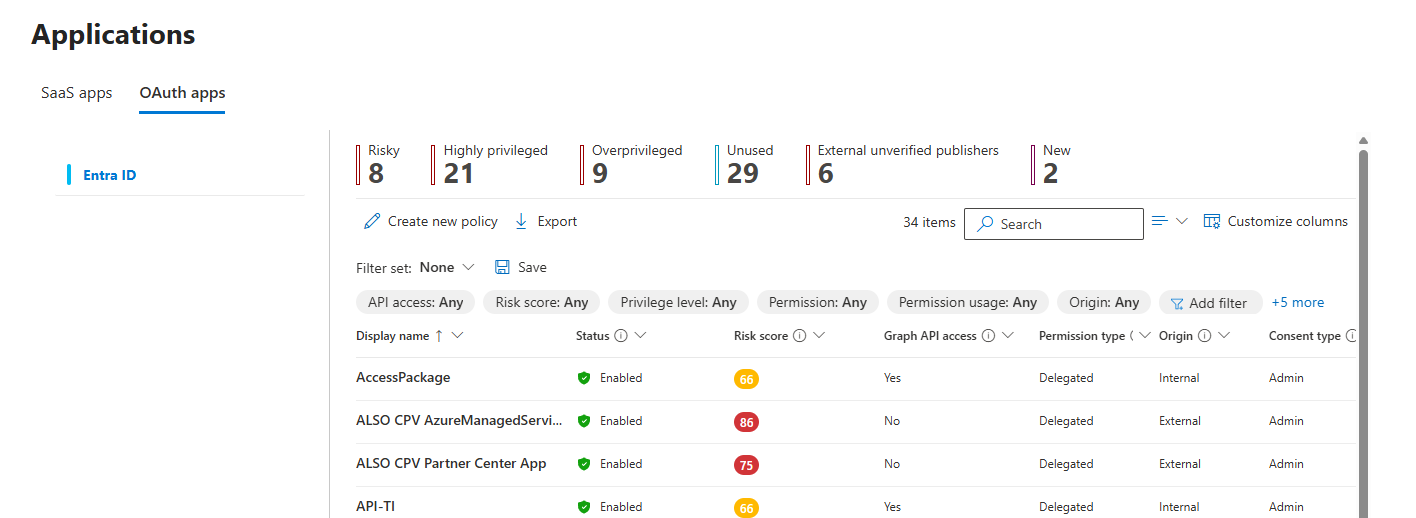
What about OAuth app monitoring? Most teams completely ignore this area. It is exactly the vector used in consent phishing campaigns and modern cloud identity attacks.
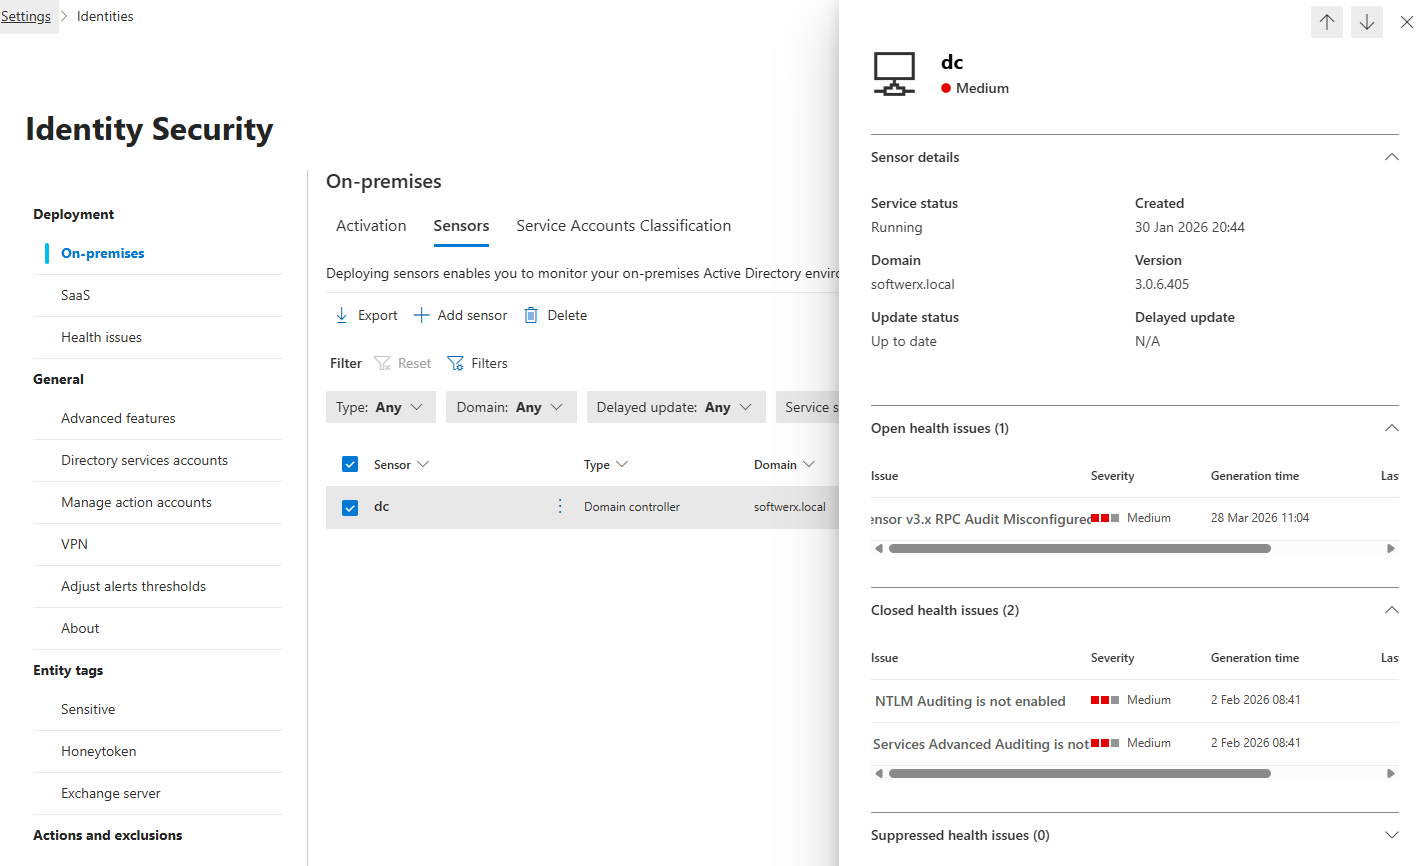
Defender for Identity: What is the sensor health status? Are any sensors in warning or error state with no remediation? Has Windows auditing been configured correctly on domain controllers per the MDI prerequisites? This one matters because without the right audit policies, Defender for Identity cannot detect certain lateral movement techniques even when the sensor is technically running.
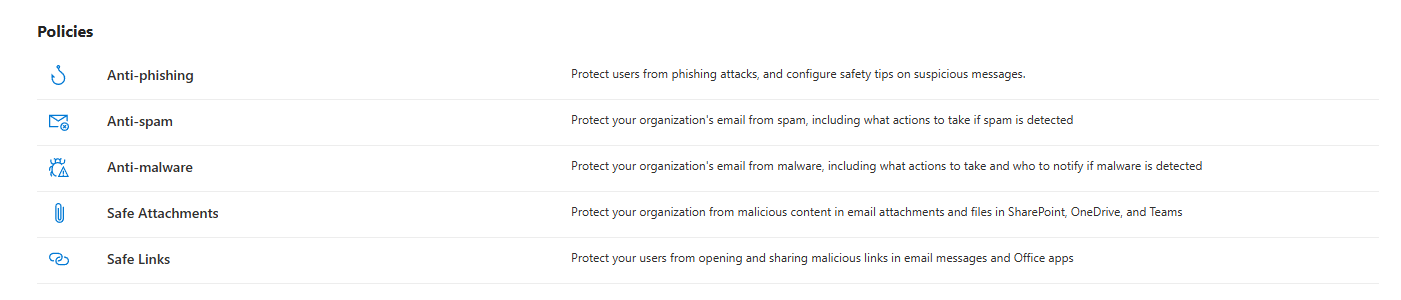
Defender for Office 365: What protection policies are enabled? Are you getting any recommendations from SOC when users are receiving more emails than usual? What about email bombing? Who is managing tenant allow/block lists?
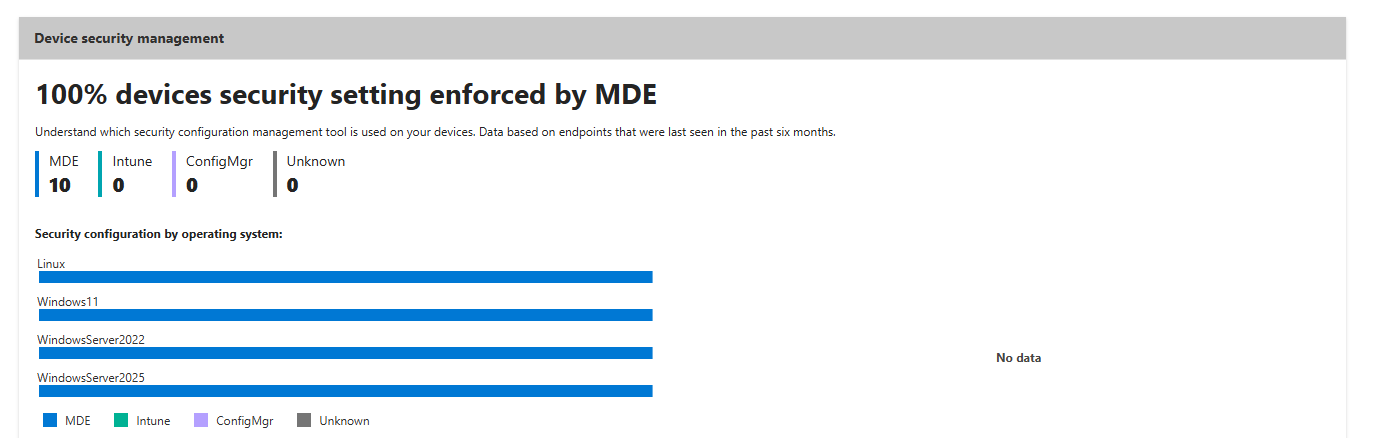
Defender for Endpoint: What is the actual onboarding coverage? Are all servers and workstations in scope? Are ASR rules in place? In audit or block mode, and why? Is anyone there to help you in case you want to check your baselines?
If the provider's answer to any of these is "we monitor what alerts come through," they are not managing the configuration. They are watching the output of a system nobody is maintaining, and of course, this could be your full responsibility depending on the contract; the trick is to actually know it for sure.
SLA: Does Anyone Actually Know the Numbers?
Ask your provider to share SLA performance metrics for the last few months. Not a verbal reassurance. The actual numbers.
Mean time to acknowledge. Mean time to respond. Mean time to resolve. Broken down by severity. If they cannot produce this data on request, it is not being tracked. If it is not being tracked, you have no idea what you are getting for your money.
Check your contract. Are the SLA targets specific? "We respond to high incidents within two hours" means nothing if it's not defined. What severity level, what incident type, what triggers the clock? If the SLA only gets reviewed at quarterly business reviews, you are getting a curated four-times-a-year snapshot instead of continuous visibility.
Incident Resolutions: Read the Closing Comments
Open your Sentinel incident queue. Pull the last twenty closed incidents. Read the comments.
What you want: evidence reviewed, conclusion reached, reason for closure clearly explained. What you often get: "False positive" with nothing else.
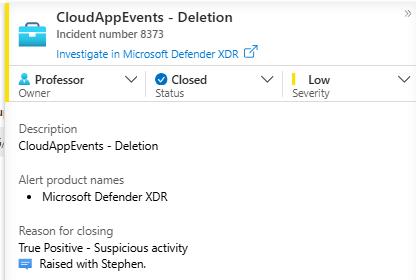
"False positive" is not a resolution. It is a label. A proper closure note tells you what was investigated, what was found, and whether any tuning action followed. If you cannot understand why an incident was closed from the comment alone, ask the provider to explain it.
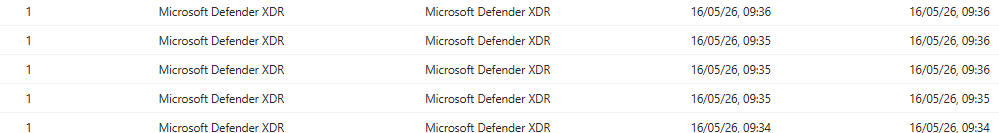
Also check whether incidents are being closed in batches. If fifteen incidents closed within thirty seconds of each other, someone mass-processed the queue (in some scenarios, it could be you with your dumb Analytic Rule 😄). That is not an investigation. That is maintenance.
Threat Hunting: The Thing That Separates a SOC from a Queue
Ask your provider when they last ran a proactive threat hunt in your environment.
Not an alert that fired. Not an investigation they handled. A proactive hunt where an analyst defined a hypothesis, went looking for a specific behaviour in the data, and were able to determine whether your environment is at risk based on that.
If the answer is "we hunt when we have capacity" or involves a long pause, you do not have a threat hunting function. You have alert processing with hunting branding applied to the sales deck.
You can ask them to "Show me a hypothesis you tested in my environment in the last 90 days and what you found" . If threat hunting is on the contract, they should be able to produce something for you without any issues.
Cost Optimisation: Who Is Watching Your Azure Bill?
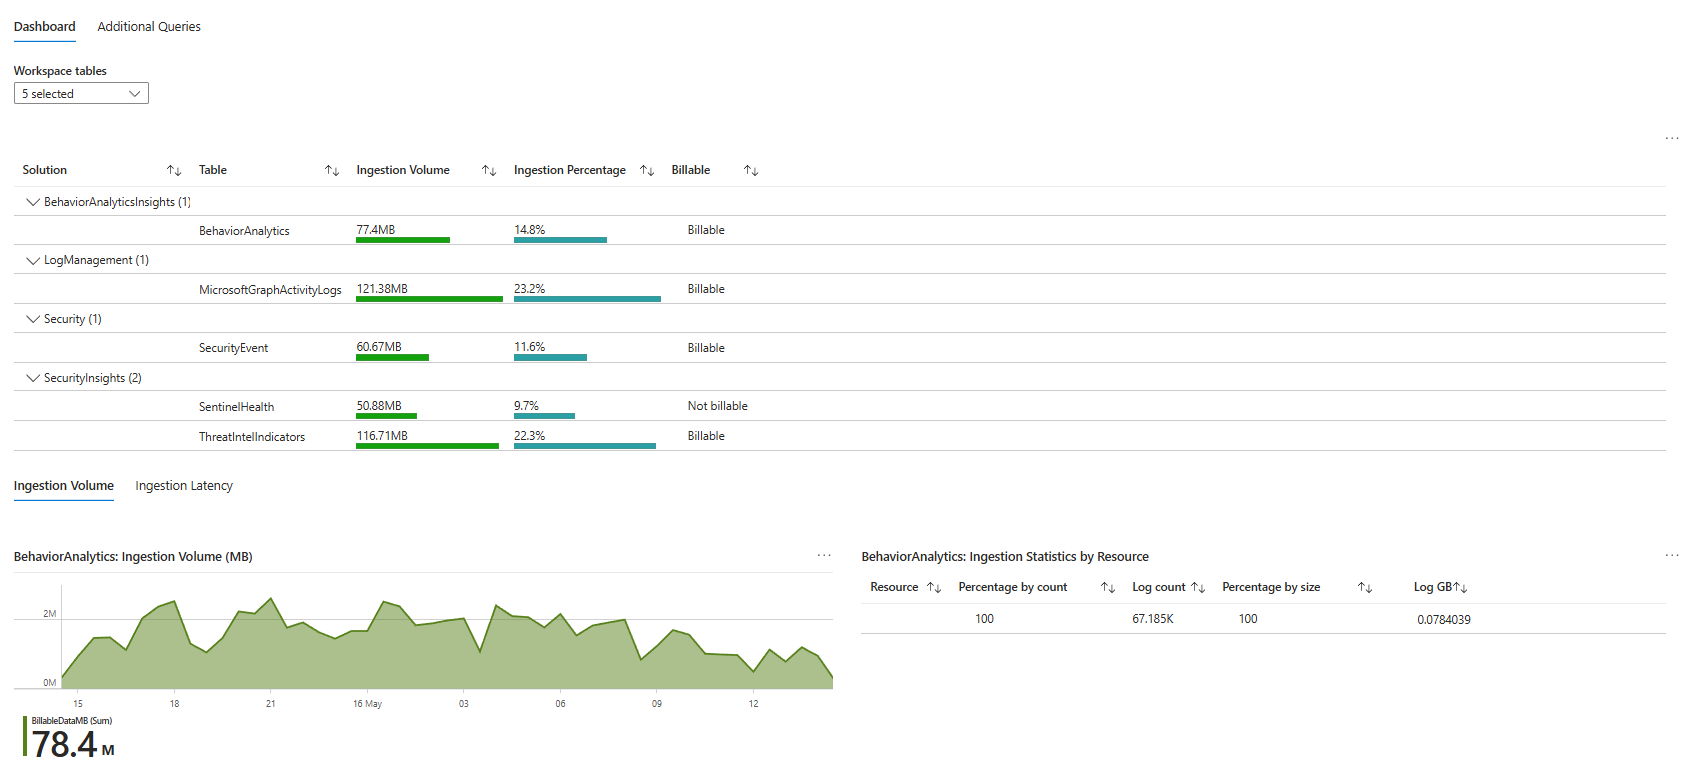
Ask your provider when they last reviewed your Sentinel ingestion costs and what they recommended as a result.
Your workspace is Azure consumption billing. Every gigabyte in the Analytics tier costs money. Rarely queried tables can go in the Basic tier or the Auxiliary tier. Expensive firewall logs can land in the Data Lake. Data sources that generate noise without enabling a single detection or helping with investigations/auditing should either be filtered at ingestion or removed.
If your provider has never initiated a cost optimisation conversation with you, ask yourself why. It's fair to expect that they will help you provide cost reports or clear visibility on your Sentinel billing (doesn't mean that you shouldn't look into it as well though!)
Ask specifically: which tables are the most expensive? Which tables have the fewest analytics rules querying them? Have you ever recommended removing a data source because the security value did not justify the cost?
Content Review: Is Anyone Actually Updating Anything?
Ask your provider how often they review the content they manage in your environment. Analytics rules. Workbooks. Automation playbooks. Data connector configuration.
Ask when they last proactively initiated a review versus waiting for you to raise something. Ask how they track that Microsoft has deprecated a connector API or updated a table schema, and how quickly they act on it.

There was a new ThreatIntelligenceIndicator schema update in 2025. There were new tables introduced via the Microsoft Defender XDR connector. If the last time your analytics rules were touched was before those changes, none of the new telemetry is feeding your detections.
A provider doing nothing content-wise for two years while the platform evolves around them is not managing your security. They are holding a contract.
What Happened at the Meeting
My friend walked in with this list. He had cross-referenced every finding against the actual contract before he sat down.
The atmosphere was, by his description, extremely tense. The SOC team apologised multiple times. They had no real answer for the analytics rules untouched since 2024. No explanation for the missing data connector tables. Could not produce SLA metrics and could not explain the auto-close rules that had been running for years without documentation.
Three years into a five year contract, the trust was gone before the meeting ended.
This does not have to be your situation. But you have to actually look.
Check All of This Now
Step 1: Open Sentinel Analytics. Sort by last modified date. If you don't see any meaningful updates being done (for example, you see 10 rules updated in the past year), it needs a conversation.
Step 2: Go through every connected data connector. Click into each one. Verify which specific tables are flowing. Write down the gaps.
Step 3: Open your workbooks. Check which ones are actually useful for your reporting and note things you would like to see in them; also, note the last modified dates.
Step 4: Review every automation rule. For any rule that closes, suppresses, or changes severity on incidents, check for a justification and an expiry date. If either is missing, flag it.
Step 5: Check Azure Diagnostic Settings for your subscription and key resources. Key Vault, NSGs, Azure Firewall, and Azure Activity Logs (and depending on your requirements, plenty more like Public IPs, SQLs, Application Insights etc..) should all ideally be sending to your workspace.
Step 6: Open Defender for Identity sensor health, Defender for Cloud recommendations, and Defender for Cloud apps dashboard. Check if anyone is doing anything with those.
Step 7: Pull the last twenty closed incidents. Read every closing comment. Score them honestly.
Step 8: Ask your provider in writing for SLA performance metrics for the last few months and the last three threat hunt reports produced for your environment.
Step 9: Pull your Sentinel ingestion cost report from Azure Cost Management or from workbooks. Ask your provider when they last reviewed it and what they recommended.
Step 10: Cross every finding against your contract. Know which are service failures and which are expectations that were never agreed. Walk into the room with facts.
Before You Call It a Failure, Read the Contract
Every finding in this post needs to be crossed against what was actually agreed in writing.
Some things that look like negligence are contract boundaries. If the SOC was engaged purely for alert triage and incident response, nobody promised detection engineering or workbook maintenance. If your Defender for Cloud plans are off because your organisation made a budget decision before the SOC engagement started, that is not automatically the provider's fault.
The question is not just "is this wrong?" The question is "was this promised, was it paid for, and is there evidence it was or was not done?"
There is also a question that folks tend to forget. Were any real incidents handled well? Were response times on actual threats acceptable? Did the SOC communicate clearly when something real happened? A provider can have outdated workbooks and still have responded correctly to every genuine incident you had. Conversely, a provider can have immaculate documentation and miss a real breach entirely.
The checklist in this post tells you what to look at and where to start. What it cannot tell you is whether any of it actually mattered to your security outcome. That judgement requires the contract, the incident history, and an honest conversation, not just a portal audit.
Class dismissed.