Defender XDR Incident Investigation: A to Z Using a Real Example

All right class.
There are a few ways you end up staring at an incident queue with no idea what to do with it.
Your company just bought Microsoft 365 E5 and someone pointed at you and said "you're the security person now." Sentinel is connected, Defender is lighting up, and nobody gave you a runbook because there was no one to write one before you.
Or you are a Tier 1 SOC analyst and this is your third week. The senior analyst is off sick. The incident is High severity. Your team lead is in a meeting. Nobody is coming to save you.
Or you are a sysadmin who got handed the security remit on top of everything else because headcount is frozen and leadership decided monitoring a SIEM is basically the same as managing a file server. It is not, but here you are.
Or you spun up your own lab, generated some synthetic alerts, and you want to actually understand what you are looking at instead of just watching dashboards go green.
Whatever brought you here, the problem is the same.
You open security.microsoft.com and see this sitting in your queue.
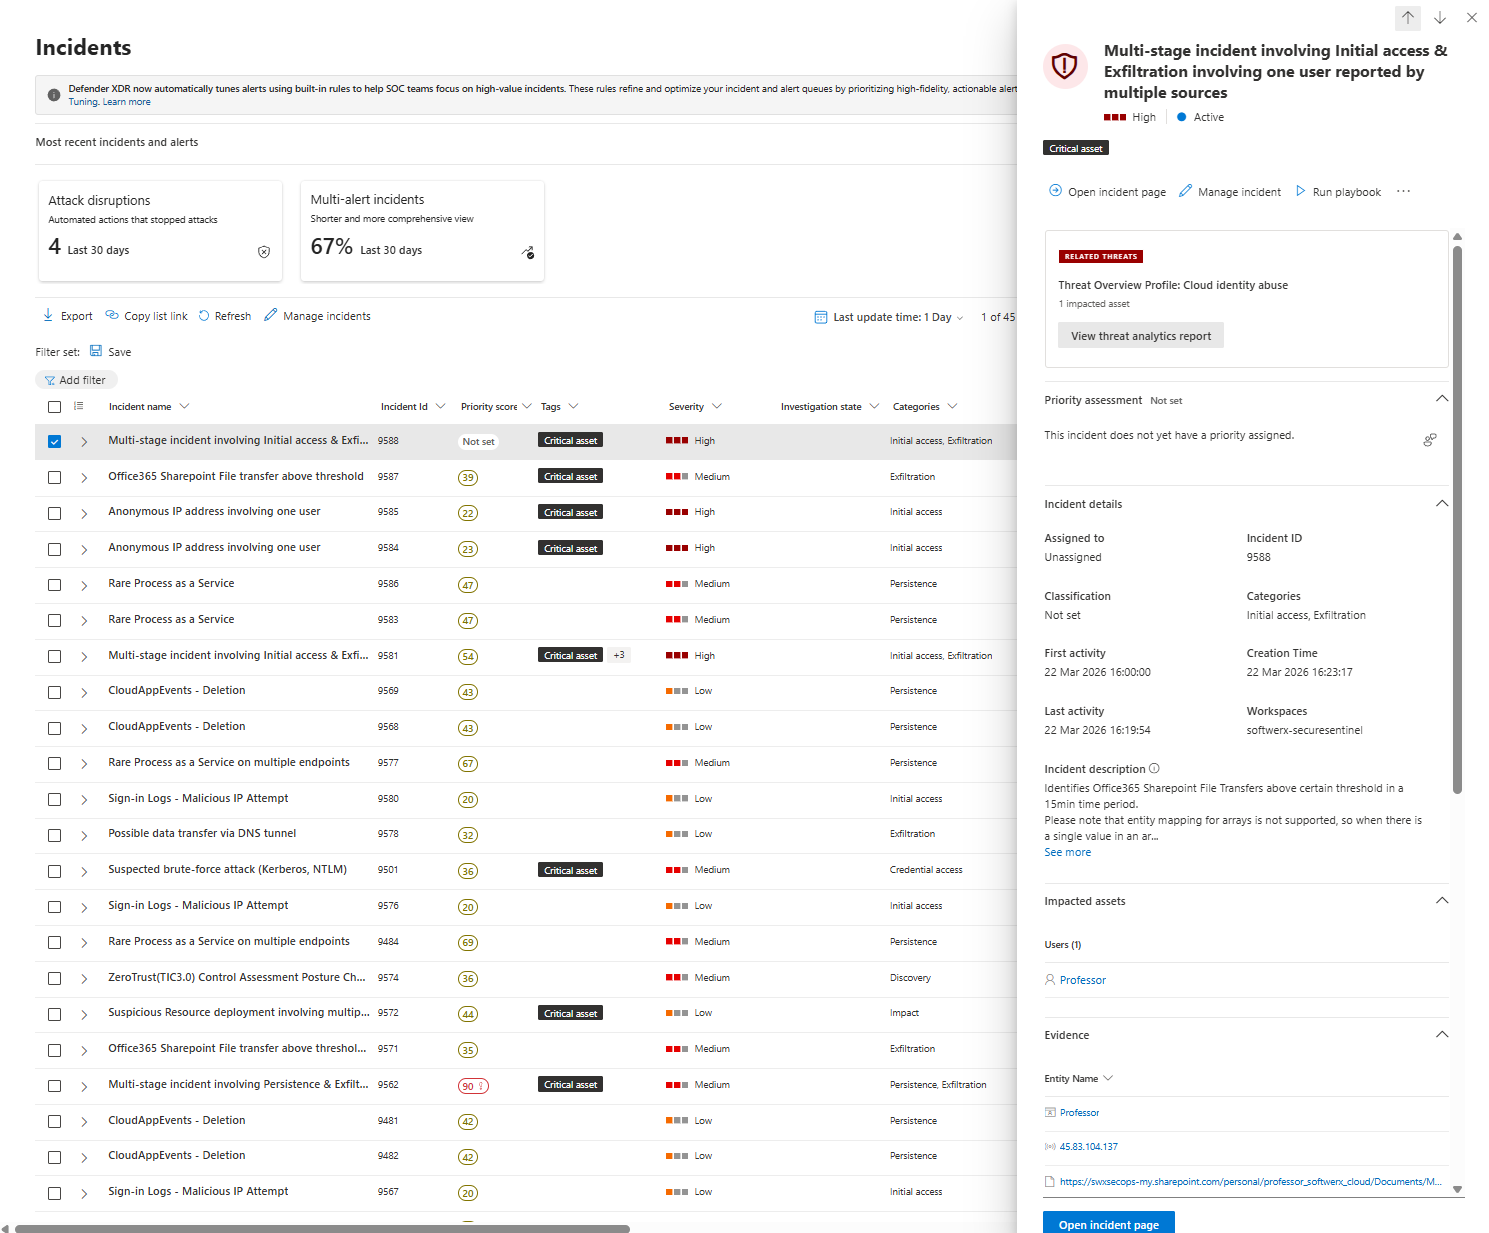
Multi stage incident involving Initial access and Exfiltration involving one user reported by multiple sources
Severity High. Active. Unassigned. Your name is not on it yet and you have no idea where to start.
The example is a cloud identity and SharePoint exfiltration case from my own lab. The method applies to pretty much anything Defender XDR or Sentinel fires at you.
One thing upfront. Everything here is done in security.microsoft.com. Not the Azure portal. Not the Sentinel blade. If you are still investigating in portal.azure.com out of habit, you are working with a fraction of the context available to you. The unified portal pulls Defender XDR signal and Sentinel workspace data into the same investigation surface and that matters (also, moving forward, it's not like you have a choice, so you can start investigating in Defender anyway 💀)
Step one: own it before you touch anything else
Go to Incidents & alerts, then Incidents. Find the incident, click on it and hit Manage incident.
Set Status to In Progress. Assign yourself as the owner. Add an incident tag where applicable.
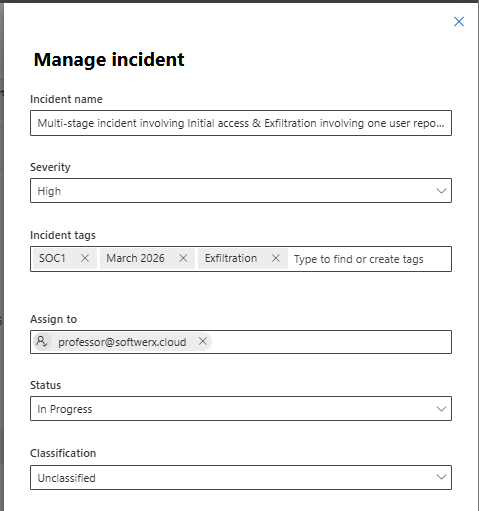
For this incident, I used SOC1, March 2026 and Exfiltration. This is not decoration. Tags let you filter reports, build workbooks, and group incidents by category for monthly reviews. Ten seconds now saves you a lot later. It's definitely worth having a conversation with your team about the Tags you could use based on your requirements.
After clicking the actual incident, look at the top of the incident page before clicking anywhere else.
You want five things from that first glance.
Severity and priority score. Which assets are impacted? Whether anything is tagged as a critical asset. And the categories, because Initial access combined with Exfiltration on the same incident is a completely different conversation to a single noisy alert.
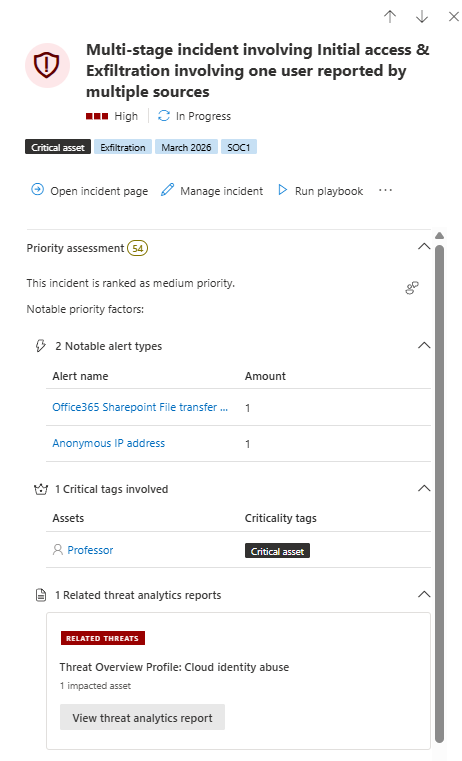
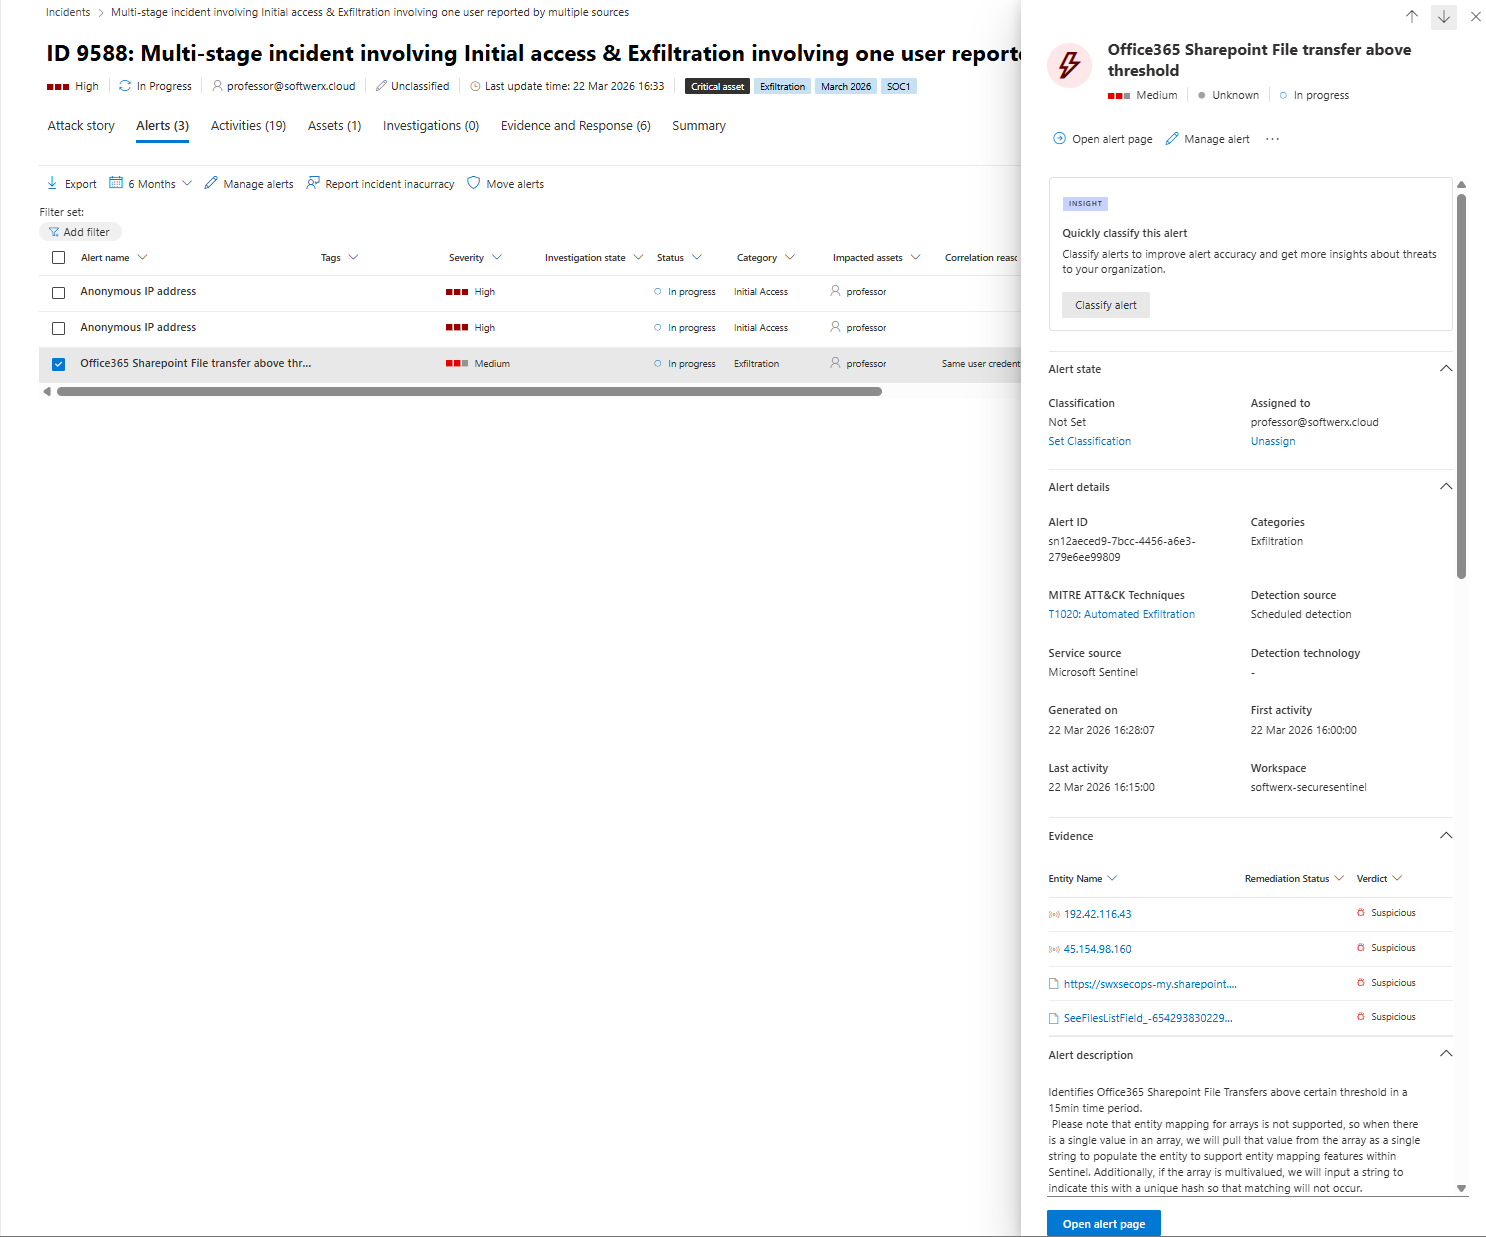
In my incident, you see this immediately.
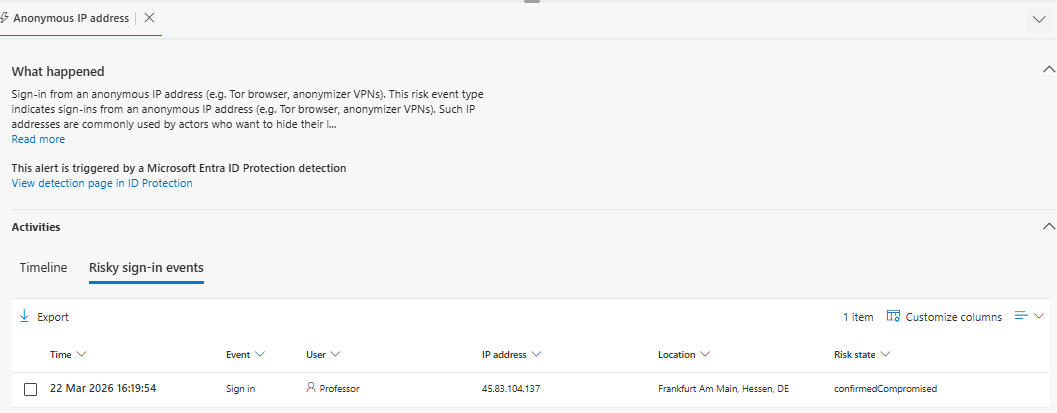
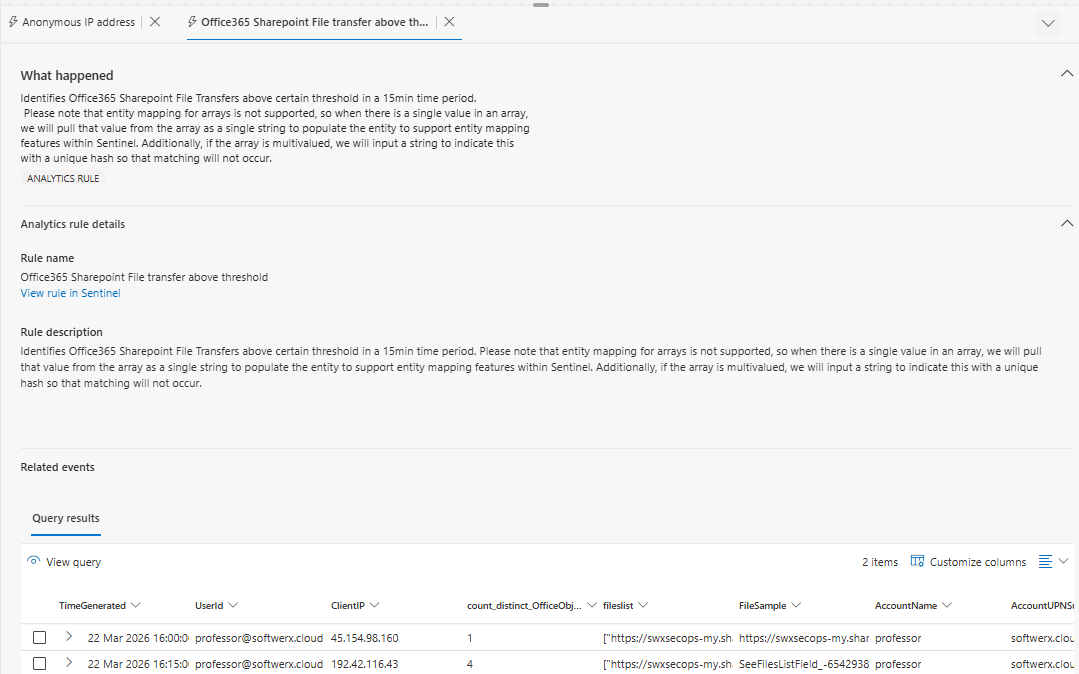
Severity: High. Priority score: 54. User tagged Critical asset. Categories: Initial access and Exfiltration. Two alert types: Office 365 SharePoint file transfer above threshold, and Anonymous IP address.
That second one comes from Entra ID Protection, not a custom analytics rule. Two different pipelines feeding one incident. That already tells you something about the scope before you read a single log.
You got your first notes already that should be added to the Activities > Add comment:
Triage note. High severity cloud identity and SharePoint exfiltration incident. User professor@softwerx.cloud flagged as a Critical asset. Alerts from Entra ID Protection and the SharePoint file transfer threshold rule. Activity started at 16:19.
The incident tabs are not decoration, read them in order
Work through the tabs left to right. Every one of them tells you something before you touch KQL.
Attack story
This is your incident graph. In my example you see one user node connected to two file nodes and three IP address nodes. When you click each alert on the left panel the graph updates to highlight which entities belong to that specific alert.
Click the SharePoint threshold alert. The graph shows the exfiltration path. Click the Anonymous IP alert. The graph shows the initial access path. In fifteen seconds you understand the shape of what happened without writing a single query.
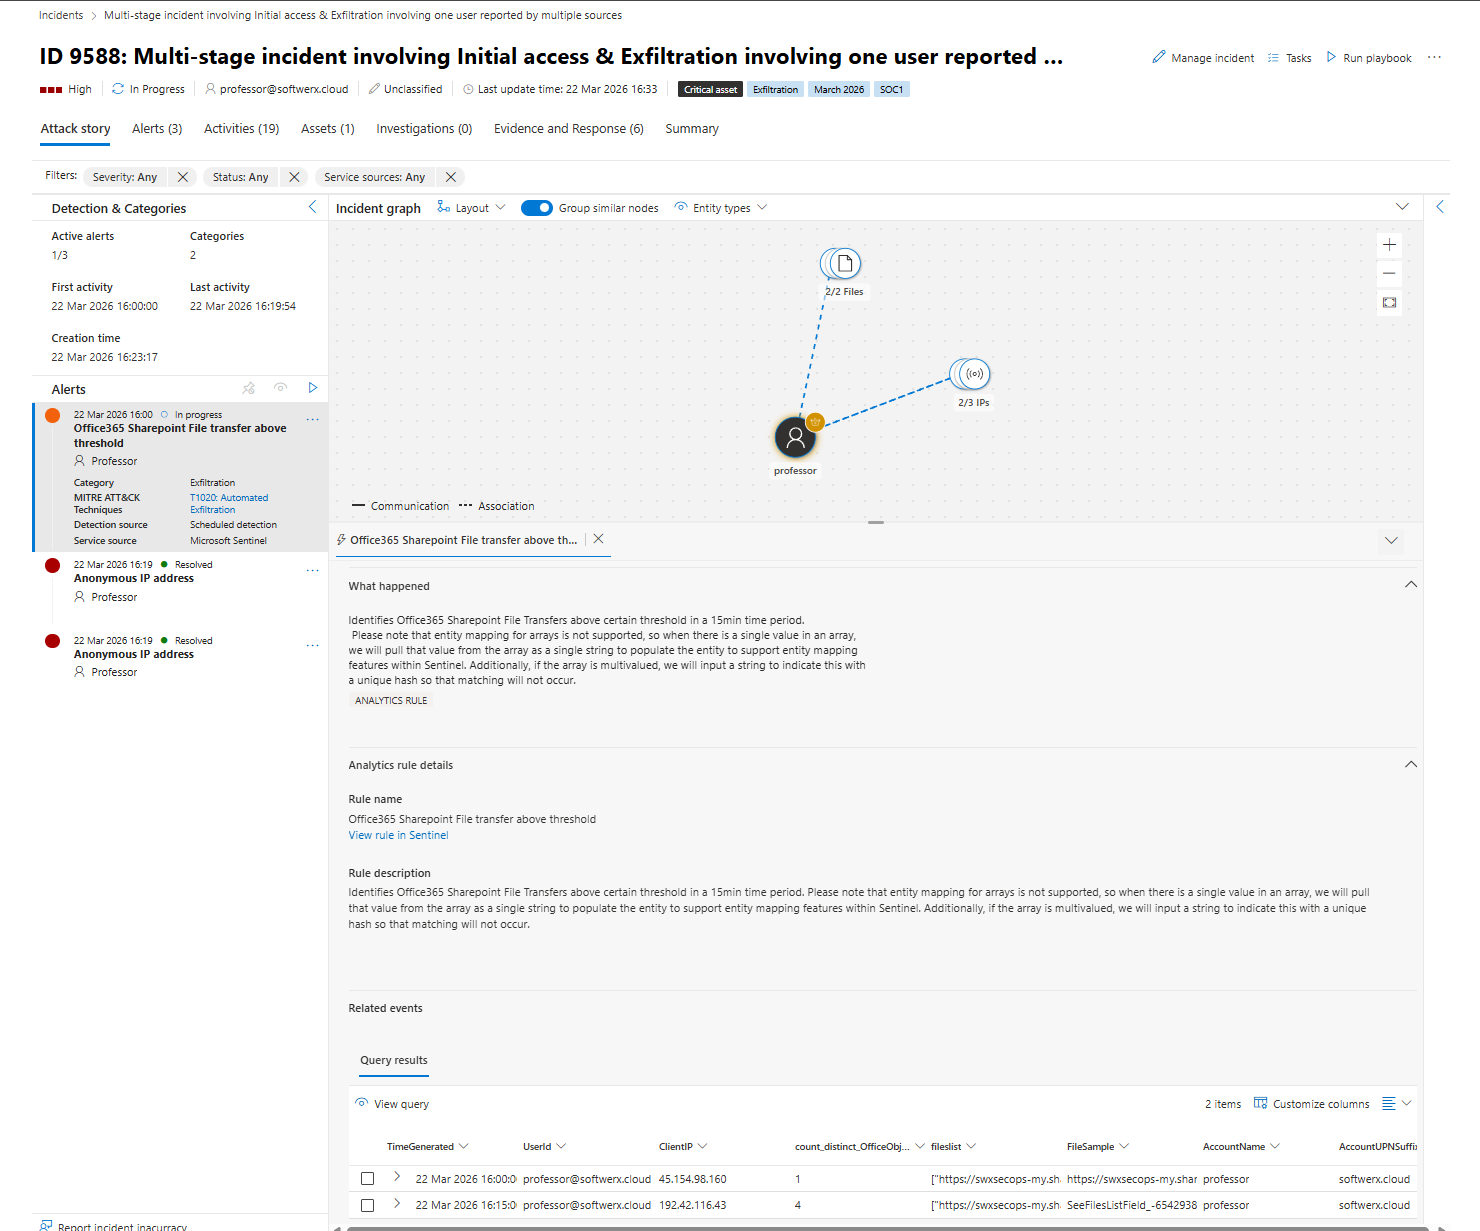
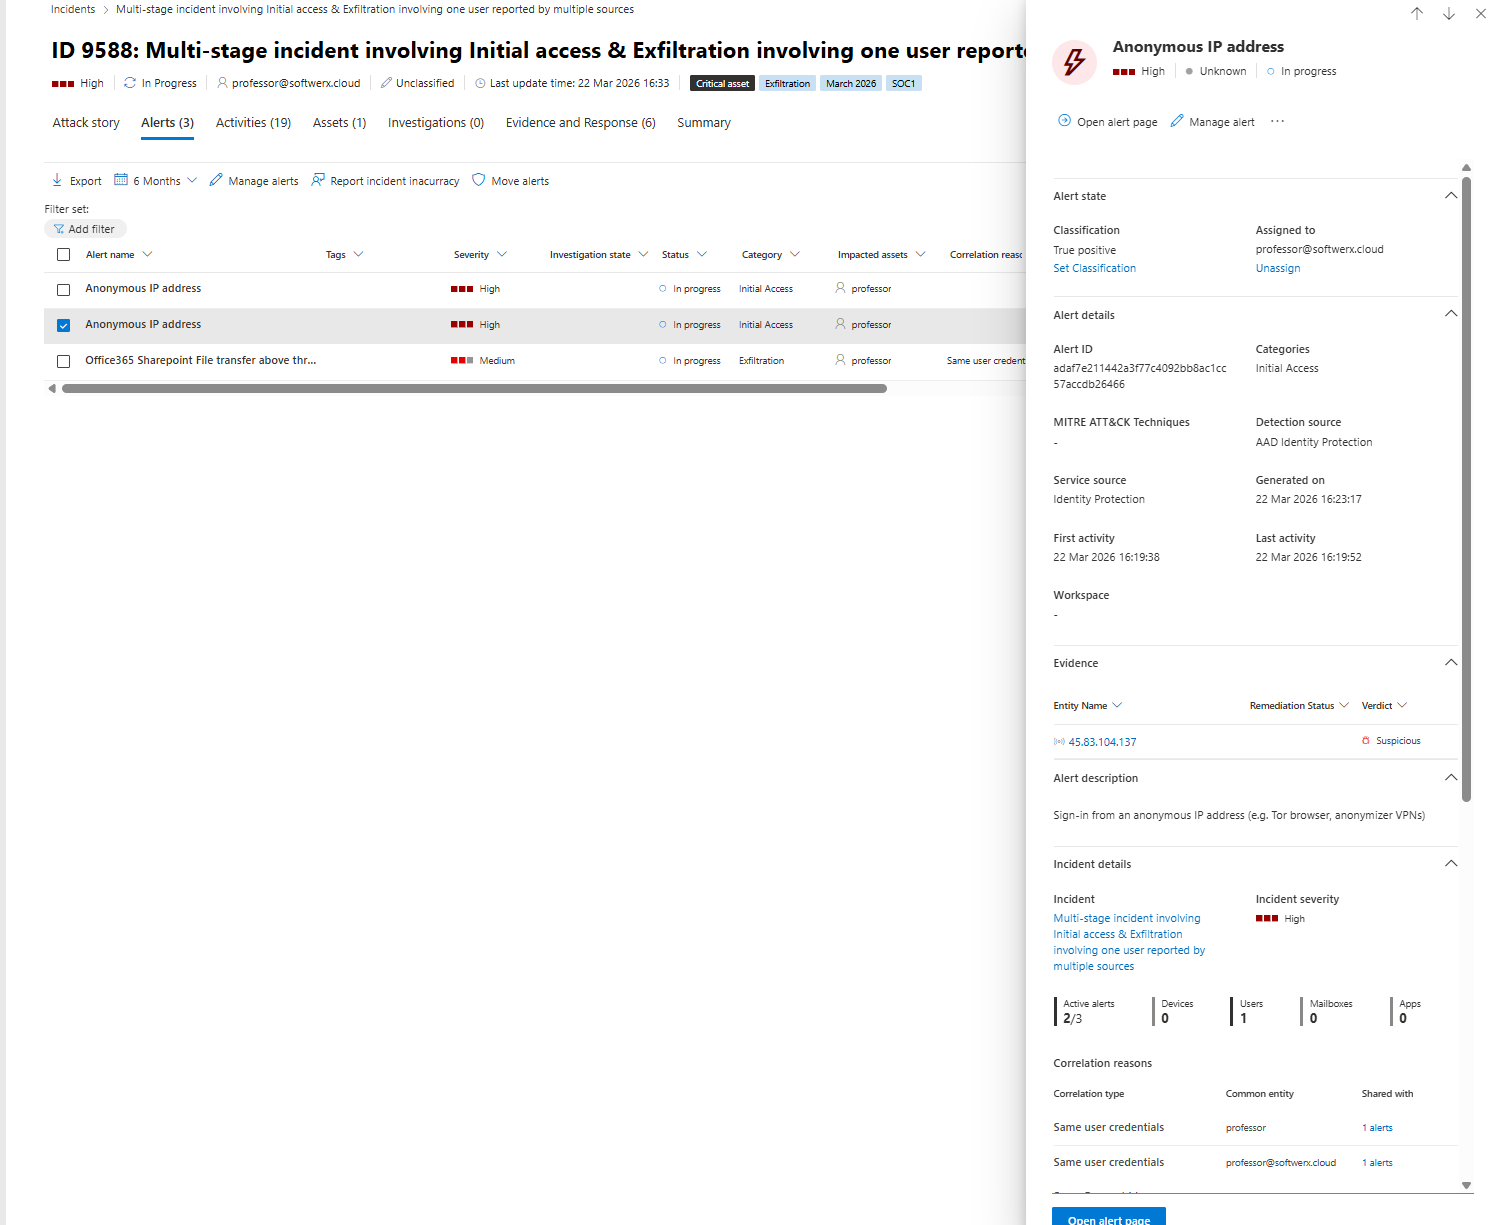
Alerts
Click each alert and read the What happened section. That text tells you which detection engine raised the alert and which table it came from. My SharePoint alert was raised by a scheduled analytics rule running against Log Analytics data. The Anonymous IP alert was raised by Entra ID Protection directly.
Those are two completely different detection sources. That distinction matters when you are hunting because you are going to different tables for each one.
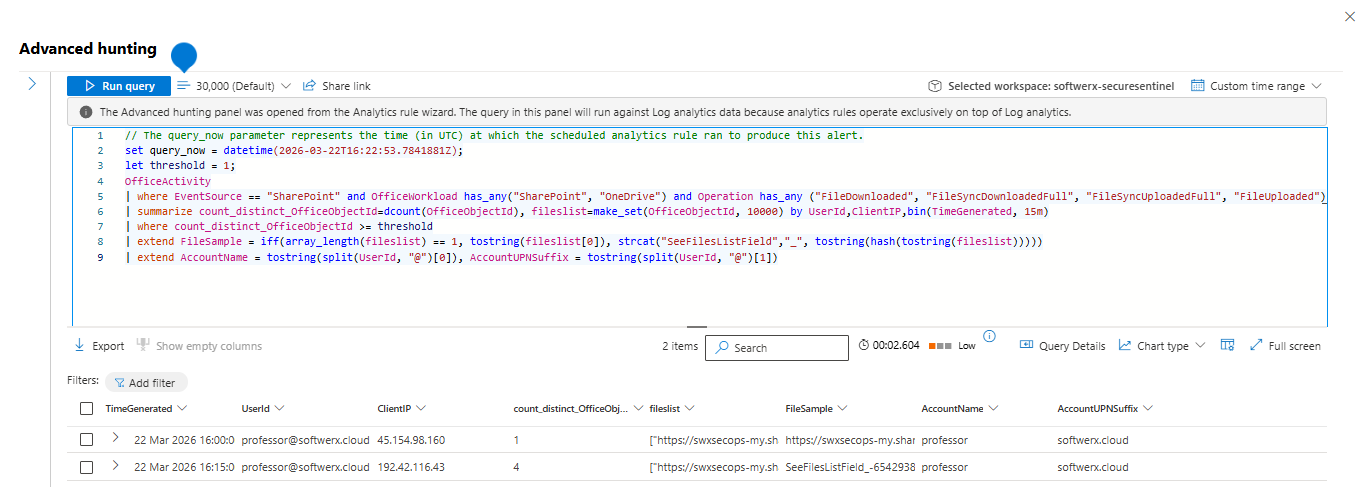
There is also a View query button inside the Attack story tab on alert rows. Click it. It opens Advanced Hunting prefilled with the KQL that produced that alert result, scoped to the incident timeframe, with real column names. That is always your best starting point for hunting. Not a template you grabbed from the internet.
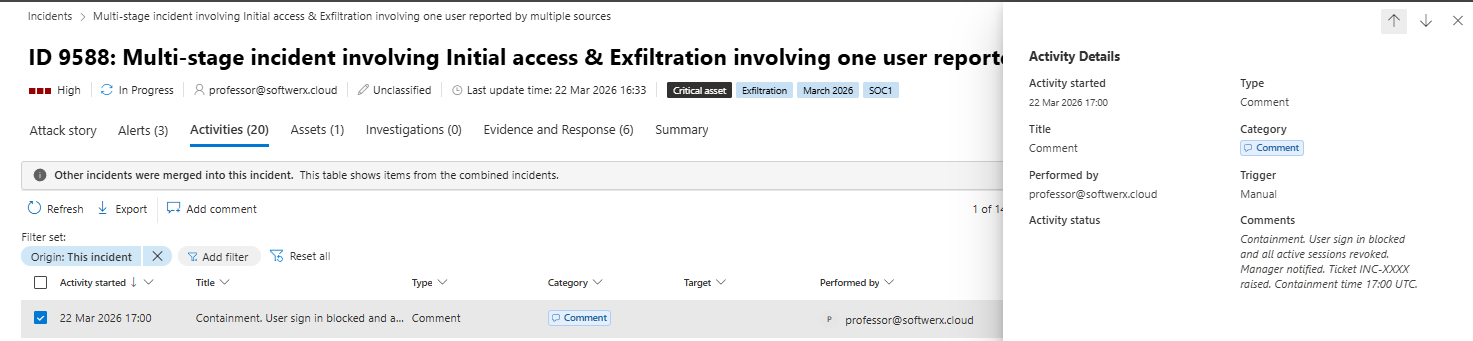
Activities
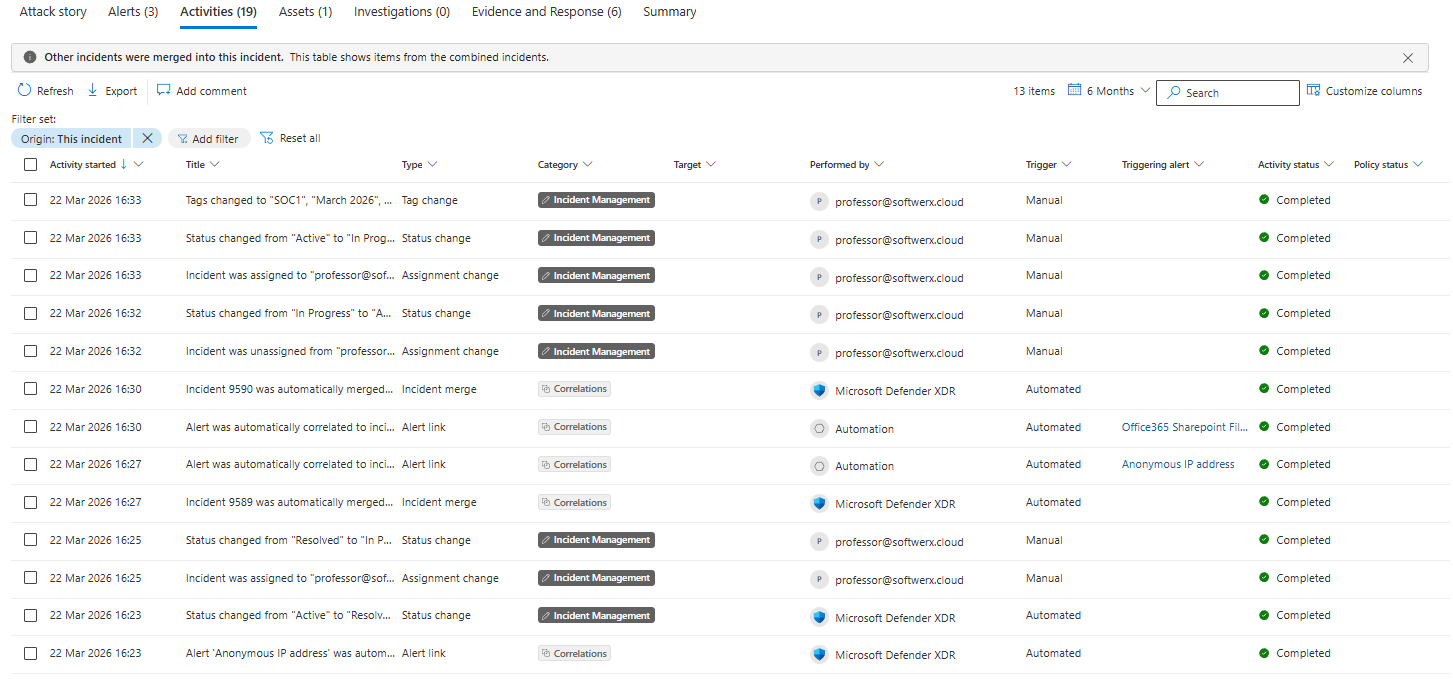
This shows what Defender has already done automatically and what Analyst changed manually. Alert correlations, incident merges, any automated investigation actions, adding tags, changing status, etc. In my lab Defender auto-merged a second incident into this one at 16:30 because the correlation engine matched the same user entity. If incidents are being merged, your scope is wider than the original two alerts.
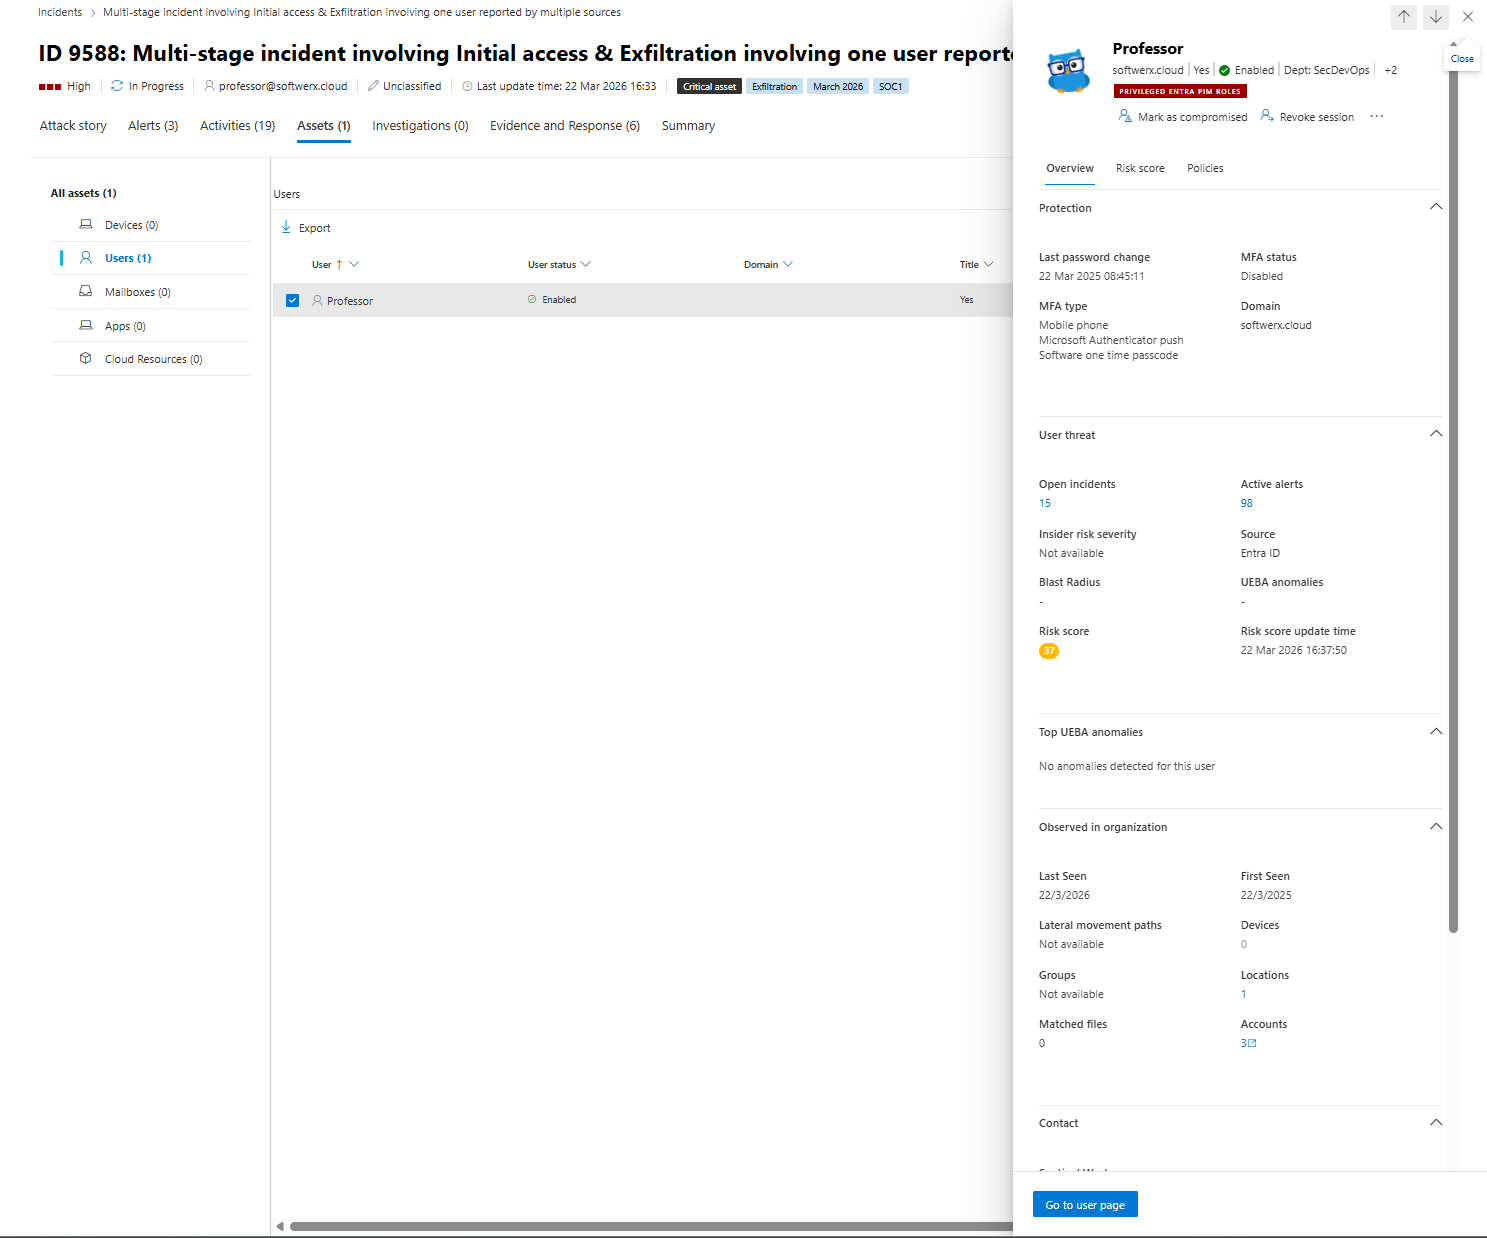
Assets
Click the user. The entity pane opens on the right. You get risk score, open incidents, active alerts, UEBA anomalies, MFA status, last password change, blast radius, and group memberships.
This is your one stop for useful information around any impacted assets, and I would highly recommend looking at this tab in every single one you will go through moving forward. It's fantastic how easy you can spot things that do not belong just based on the risk scores and policies applied.
Evidence and response
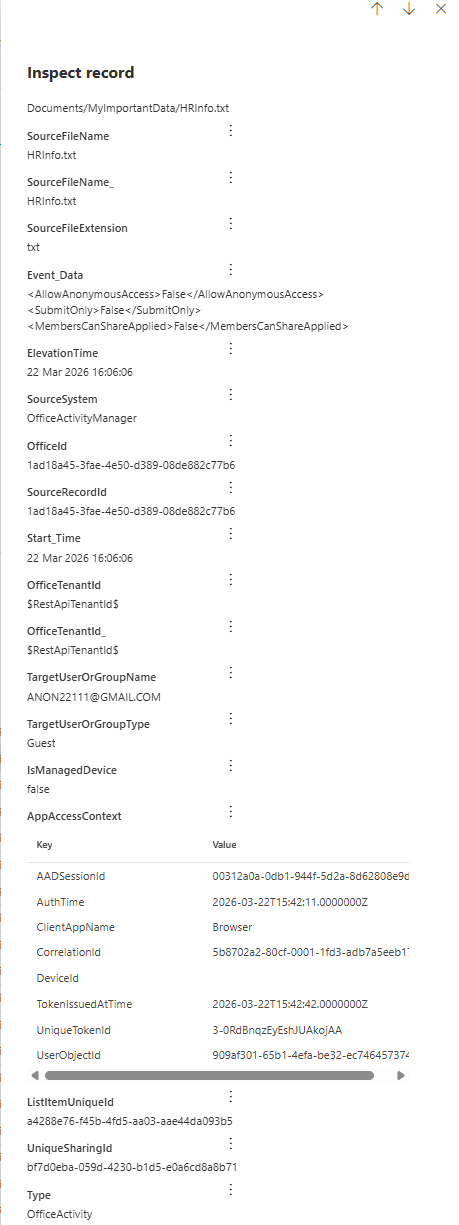
In my incident there are six evidence items. Three IP addresses, two files, and one cloud logon session, all flagged Suspicious. Click every row and expand the inspect panel.
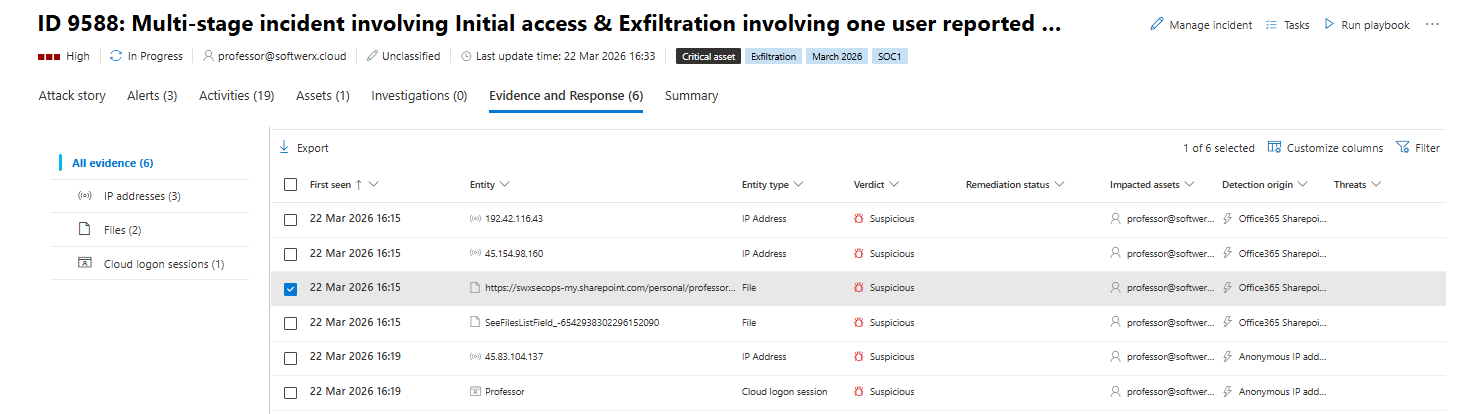
You already know the IPs involved, you already know which SharePoint paths were touched, and you know the session entity before you open hunting. That is the whole point of reading the evidence tab first.

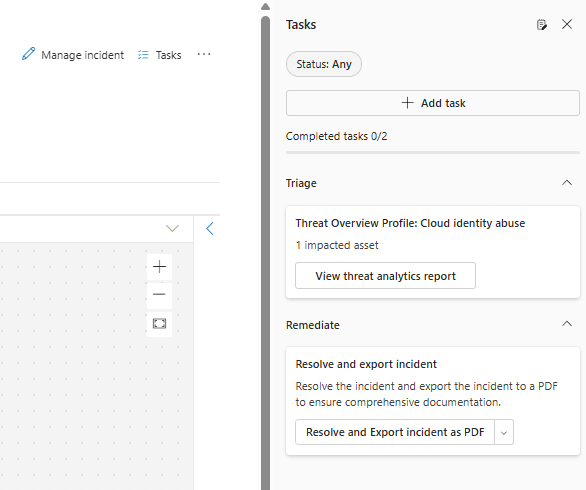
Tasks
The Tasks pane sits on the right side of the incident page. It comes with pre-populated cards like View threat analytics report and Resolve and export incident as PDF. Add your own tasks as you investigate and tick them off. That pane feeds into the PDF export at the end, which means your working notes become part of your report automatically.
Containment: This decision comes before hunting, not after
For a cloud identity incident, the containment decision is simple.
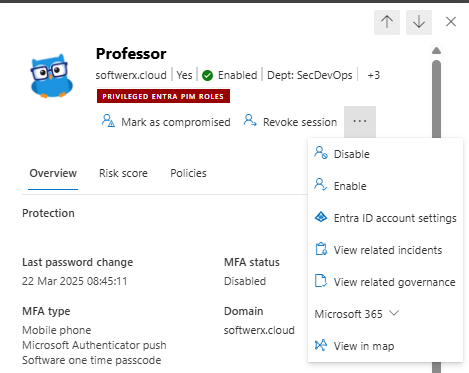
Anonymous or impossible location sign-in that succeeded from IP addresses that are flagged as suspicious, a user tagged as a high-value or critical asset, and evidence of data movement already in the evidence tab. All three are present in my incident. You block the account before you investigate the scope, not after.
From the Assets tab, click the user entity and look for Disable, Revoke session and Mark as compromised. They are available from the user entity pane on the right side of the screen. If you have a playbook wired to run containment via Logic Apps, trigger it from Run playbook at the top of the incident page (you can also attach the Playbook to run directly when the incident is live, but that's a story for another time)
Log it immediately in your notes/Activity tab (ideally the second one so everyone can see a clear picture, even 6 months from now)
Containment. User sign in blocked and all active sessions revoked. Manager notified. Ticket INC-XXXX raised. Containment time 13:45 UTC.
Now the fire hose is closed. Time to understand what already happened.
Advanced hunting: start from the incident, not from scratch
At this point, you actually do have a good picture of what happened just based on the Attack story you looked at.
We have a risky sign-in event
Followed by file share
But where is the fun in looking at a GUI only? Let's use some KQL
You are in security.microsoft.com under Hunting, Advanced hunting.
Start with what you already know from the incident. User account, time window, and the IPs from the evidence tab.
Reconstruct the sign in
let targetUser = "professor@softwerx.cloud";
let badIPs = dynamic(["192.42.116.43", "45.154.98.160", "45.83.104.137"]);
let windowStart = datetime(2026-03-22T15:00:00Z);
let windowEnd   = datetime(2026-03-22T16:20:00Z);
SigninLogs
| where TimeGenerated between (windowStart .. windowEnd)
| where UserPrincipalName == targetUser
| where IPAddress in (badIPs)
| project
    TimeGenerated,
    UserPrincipalName,
    AppDisplayName,
    IPAddress,
    ResultType,
    ResultDescription,
    ClientAppUsed,
    ConditionalAccessStatus,
    AuthenticationDetails
| order by TimeGenerated asc
You are usually looking for the pattern of failures followed by a success from the same IP. In my incident, the anonymous IP appears in failures before a successful logon, which means the session in the Evidence tab has a corresponding authentication trail here.
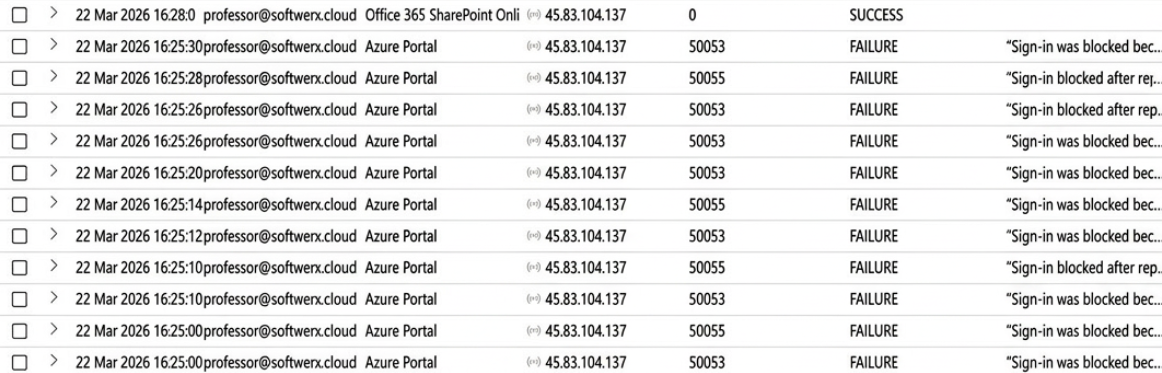
How the hell did they get in at all
Right now you know when they logged in and from where. You still do not know why that sign in was allowed.
This is the bit your manager, CISO, or client will throw at you every single time.
“Was MFA on that account or not?”
“Did Conditional Access even look at this?”
“Why did Identity Protection scream ‘anonymous IP’ and we still let them in?”
You cannot hand‑wave that. You need to show exactly how Entra evaluated this sign in using the SigninLogs data: authentication methods, Conditional Access result, and risk level.
let targetUser   = "professor@softwerx.cloud";
let windowStart = datetime(2026-03-22T15:00:00Z);
let windowEnd   = datetime(2026-03-22T16:20:00Z);
SigninLogs
| where TimeGenerated between (windowStart .. windowEnd)
| where UserPrincipalName == targetUser
| where IPAddress in ("192.42.116.43", "45.154.98.160", "45.83.104.137")
| project
    TimeGenerated,
    UserPrincipalName,
    IPAddress,
    ResultType,
    ResultDescription,
    AuthenticationMethodsUsed,
    AuthenticationRequirement,
    AuthenticationRequirementPolicies,
    ConditionalAccessStatus,
    ConditionalAccessPolicies,
    RiskLevelDuringSignIn,
    RiskLevelAggregated,
    RiskDetail,
    RiskEventTypes_V2
Now you can answer real questions instead of guessing.
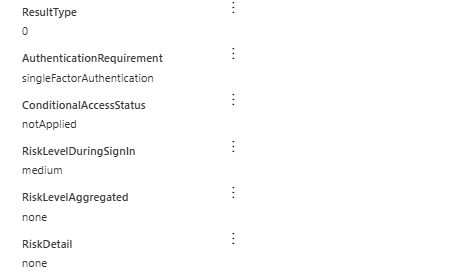
If AuthenticationRequirement only shows singleFactorAuthentication, congratulations, your "MFA everywhere" story was never true. If ConditionalAccessStatus is notApplied, you know straight away this user or app is not in scope of any serious Conditional Access at all.
You also see the Identity Protection side of the story right there. RiskLevelDuringSignIn, RiskLevelAggregated tell you how risky Entra thought this sign in was, and why. High risk from anonymizedIPAddress plus maliciousIPAddress with a successful sign in and no blocking action usually means someone created a pretty dashboard about risk but never tied it to Conditional Access
Check what that IP touched across the whole tenant
Not just the one user. If a suspicious IP authenticated successfully, you want to know whether it touched anything else.
let badIPs = dynamic(["192.42.116.43", "45.154.98.160", "45.83.104.137"]);
let windowStart = datetime(2026-03-22T15:00:00Z);
let windowEnd   = datetime(2026-03-22T16:20:00Z);
SigninLogs
| where TimeGenerated between (windowStart .. windowEnd)
| where IPAddress in (badIPs)
| summarize
    Users   = make_set(UserDisplayName),
    Apps    = make_set(AppDisplayName),
    Results = make_set(ResultDescription)
    by IPAddress
If that returns more than one user, widen the scope of the incident immediately. Do not assume it is contained to one account.

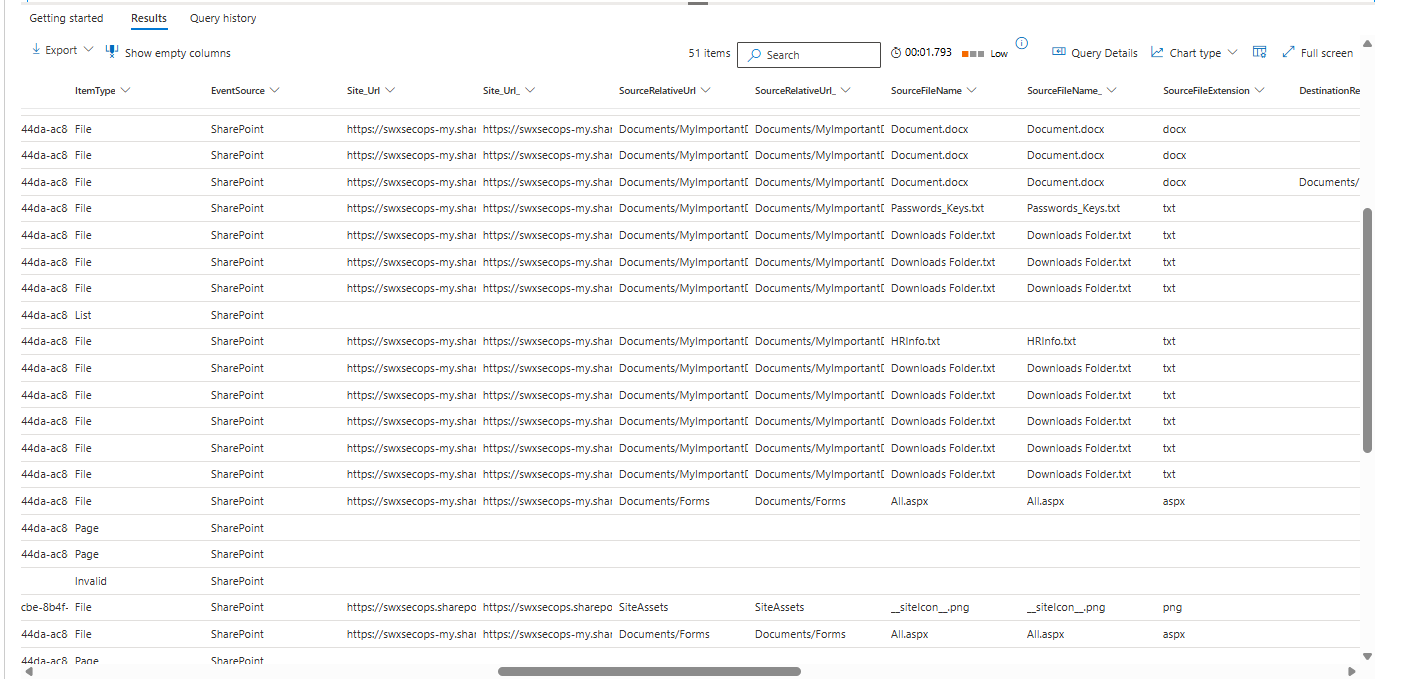
Find what SharePoint files were actually touched
This is in the OfficeActivity table, we are looking for any operations at first and then we can scope down to a specifics (like sharing for example)
let targetUser = "professor@softwerx.cloud";
let badIPs = dynamic(["192.42.116.43", "45.154.98.160", "45.83.104.137"]);
let windowStart = datetime(2026-03-22T15:00:00Z);
let windowEnd   = datetime(2026-03-22T16:20:00Z);
OfficeActivity
| where TimeGenerated between (windowStart .. windowEnd)
| where OfficeWorkload in ("SharePoint", "OneDrive")
| where UserId == targetUser or ClientIP in (badIPs)
| project
    TimeGenerated,
    UserId,
    ClientIP,
    Operation,
    SourceFileName,
    SourceRelativeUrl,
    OfficeObjectId
| order by TimeGenerated asc
In my incident, this confirms that files like Passwords_Keys.txt were shared externally with some random gmail account. That is your exfiltration evidence right there.
Hunt for mailbox persistence
Attackers who get into an account often drop inbox rules immediately. Forward everything to an external address or silently delete security alerts so the user never sees them. Check for it.
let targetUser = "professor@softwerx.cloud";
let windowStart = datetime(2026-03-22T15:00:00Z);
let windowEnd   = datetime(2026-03-22T16:20:00Z);
OfficeActivity
| where TimeGenerated between (windowStart .. windowEnd)
| where OfficeWorkload == "Exchange"
| where Operation in ("New-InboxRule", "Set-InboxRule")
| where UserId == targetUser
| project
    TimeGenerated,
    UserId,
    Operation,
    ClientIP,
    UserAgent,
    Parameters
| order by TimeGenerated asc
If you see any rules here, expand the results and look at the Parameters. A rule forwarding to a Gmail address or deleting emails containing the word Warning is not a coincidence.
Check for privilege escalation via Entra group changes
For cloud group membership changes in Entra ID this lives in AuditLogs, which is your Sentinel workspace table. Use TimeGenerated here, not Timestamp.
let targetUser = "professor@softwerx.cloud";
AuditLogs
| where TimeGenerated > datetime(2026-03-22T09:00:00Z)
| where OperationName has_any ("Add member to group", "Add user to role")
| extend
    Target = tostring(TargetResources[0].userPrincipalName),
    Group  = tostring(TargetResources[0].displayName),
    Actor  = tostring(InitiatedBy.user.userPrincipalName)
| where Target == targetUser or Actor == targetUser
| project TimeGenerated, OperationName, Group, Target, Actor
If the compromised account was added to a group with Admin, Global, or Privileged in the name during the incident window, this is no longer a SharePoint exfil case. That is a full compromise.
Drop notes in the incident Activities tab every time you confirm or rule something out. Not in a private doc. In the incident.
Closing the incident properly
When you have answers to these questions, you are ready to close.
Was this real abuse or noise? What was the initial entry point? What did they access? What containment actions were taken? What needs to change?
Go back to Manage incident at the top of the page.
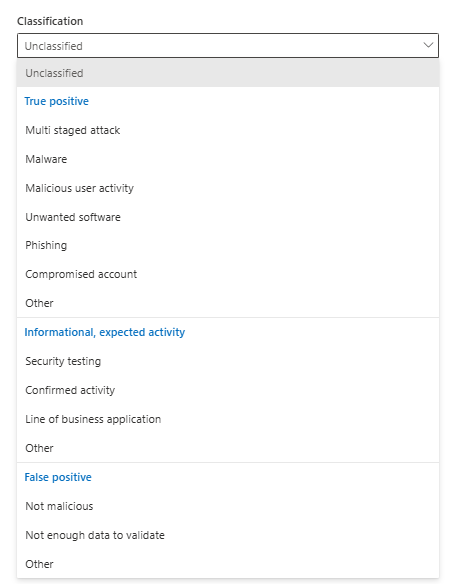
Set Status to Resolved. Set Classification to True alert or False alert. Set it to something specific, like a multi-staged attack.
Now write a closing comment that an auditor, a manager, or an analyst picking this up in six months can read and fully understand without calling you.
True positive multi stage cloud identity and SharePoint exfiltration incident for user professor@softwerx.cloud. Rough timeline captured in incident notes shows risky anonymous IP sign in, followed by successful authentication and subsequent SharePoint activity on the same session.
Initial access was granted via successful sign in from IPs 192.42.116.43, 45.154.98.160 and 45.83.104.137, evaluated by Entra as risky but not blocked by Conditional Access. Sign‑in logs confirm password based authentication with no enforced MFA challenge on this session and Conditional Access policies either not in scope or running in report‑only for this user.
During the session, three sensitive files were accessed and shared: HR/Document.docx and HR/CompanyData.txt from the HR SharePoint library, and DevOps/UserInformation.txt from the DevOps library, with external sharing to a consumer Gmail address "xxxx" recorded in OfficeActivity. No additional users were accessed from these IPs during the investigation window and no other apps were successfully accessed beyond SharePoint and the Microsoft 365 portal.
No evidence of mailbox rule creation, privilege escalation or lateral movement was found. Checks across OfficeActivity, AuditLogs and IdentityDirectoryEvents confirmed no new inbox rules, no new role assignments and no membership changes to privileged groups involving this account. Scope is confirmed to a single user and single browser session.
Containment actions: user sign in blocked and all active sessions revoked at xxxx UTC. User’s password reset, outstanding sessions invalidated and device sign‑ins reviewed. Manager informed via incident ticket and email, CISO notified via security incident channel with link to the incident.
Follow up: run a Conditional Access policy review focusing on risky and anonymous IP sign ins for all users in the same department and role. Move relevant risk based policies from report‑only to enforce. Add this user to a targeted awareness and phishing training campaign. DevOps and HR data owners have been briefed and asked to review the impacted files for potential data leakage. The TI team has been provided with the offending IP addresses and recipient email details for further enrichment and potential blocklisting.
Pre-close checklist
- Incident owned, status set to In progress, tagged, and first triage note written before investigating
- Alerts, Assets, Evidence and response, Activities, and Attack story all read before opening Advanced Hunting
- Containment decision made early and documented in Activities.
- Appropriate tables checked for trail. Suspicious IPs checked across the whole tenant, not just one user
- Mailbox rules and anything that could potentially lead to data exfiltration checked
- Privilege escalation checked in AuditLogs for Entra and IdentityDirectoryEvents for on-prem AD
- Incident closed with full classification, determination, and a written closing note covering entry, scope, containment, and next steps
Class dismissed.