You're Paying for Defender XDR Features You Never Enabled

All right class.
You got yourself a good little E5 license. Defender is onboarded. You've got incidents firing, KQL running, analysts investigating. Job done, right?
Go to Settings > Endpoints > Advanced features in the Defender portal. I'll wait.
That page is a graveyard of capabilities you are already paying for and have never touched. I see this constantly across environments. Licenses purchased, platform deployed, and then nobody ever went back to turn on the things that actually make it powerful. This post is about fixing that.
The Page Nobody Visits Twice After Onboarding
The Advanced features page sits under Settings > Endpoints > Advanced features. It looks boring. It is not boring. It is where Microsoft hid a significant chunk of your E5 investment and waited to see if you would ever find it.
Walk through it with me.
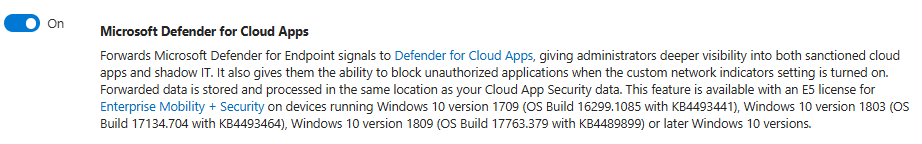
Defender for Cloud Apps Integration: You're Already Paying For It
This one makes me genuinely annoyed every time I see it disabled.
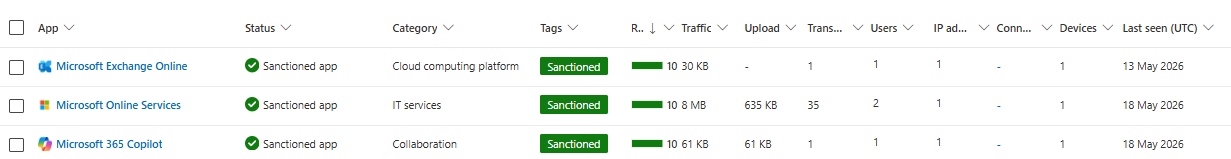
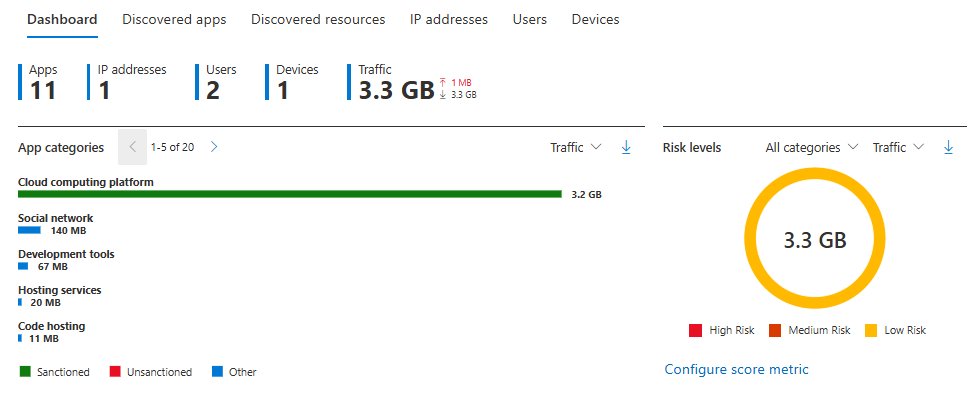
The toggle forwards Defender for Endpoint network signals into Defender for Cloud Apps. Once it is on, every browser-based connection from your managed devices gets parsed through Cloud Discovery. You get a live picture of which cloud services your estate actually talks to, with risk scores, categories, and per-device drill-down.
Nobody tells you this, but this is how you get real shadow IT data. Not a quarterly questionnaire. Not a proxy log dump. Live, continuous, per-device cloud app visibility using telemetry you are already collecting.
What breaks if you ignore it? Every data exfiltration investigation that involves a random SaaS tool becomes a manual exercise in digging through browser history. You have no structured view of what cloud services your devices actually use.
Enable this and give it a week. Your first Cloud Discovery report will show you things that will make your CISO uncomfortable and your security architecture review overdue.
One warning: Cloud Apps tend to be noisy out of the box with default policies (if you enable them). You will need to build governance policies and tune discovery reports, otherwise you will be looking at alerts about someone opening Twitter from a managed laptop. That is on your configuration, not the product. Luckily, I got you covered already

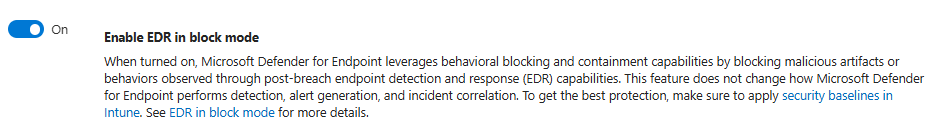
EDR In Block Mode: The Safety Net For Your Messy Estate
EDR in block mode lets Defender act on behavioural detections even when it is running in passive mode alongside a third party AV. The EDR engine keeps watching, and when it sees something it recognises as malicious based on post-breach detection logic, it blocks it even without being the primary on-access scanner.
This matters in production because nobody has a clean estate. There is always a legacy server where someone insisted on keeping McAfee running because of a line-of-business application written in 2009. Without EDR in block mode, those machines are relying entirely on the third party product for active blocking. With it, Defender's EDR engine backs them up silently.
Do not turn it on globally in ten seconds. Pilot it. If you have a messy environment with unsigned tooling, custom scripts, and lots of exclusions, test first. The feature is solid but it is not aware of your specific operational debt.
Device Discovery: Free Detection You're Not Running
Standard discovery mode uses your onboarded Windows devices as passive sensors to actively probe the local network and find unmanaged machines. You get a device inventory that includes things you have never onboarded, including random laptops, printers, switches, and whatever else is sitting on your corporate network without an agent.
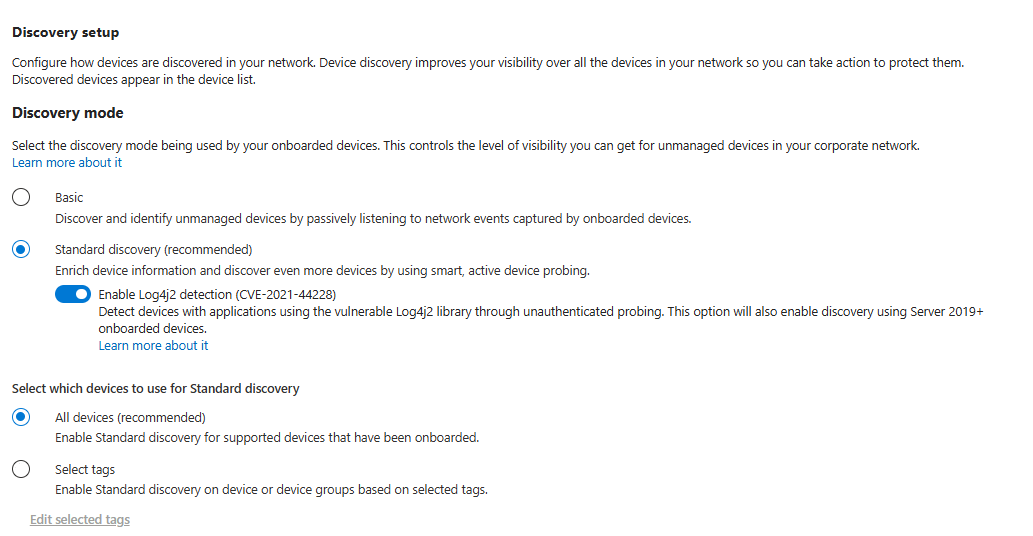
Set it to Standard and scope to All devices. Basic discovery just listens passively. Standard discovery actually goes and finds things. The difference in coverage is enormous.
What you can do with the data is what makes this special. You can query DeviceInfo in Advanced Hunting for devices that do not match your hostname naming convention. You can build a Sentinel analytics rule that fires whenever a new device appears in a network segment it has no business being in. That is a detection that costs you nothing extra and catches rogue devices or lateral movement onto unmanaged hardware.
One operational note: Standard discovery uses signed PowerShell scripts that get executed on your endpoints. Some third-party security tools flag this. Add the relevant path to your allow lists instead of disabling the feature.
Tamper Protection: If This Is Off, You Have A Serious Problem
Tamper protection prevents local and remote modification of critical Defender settings. Things like disabling real-time protection, adding exclusions, or turning off cloud-delivered protection. When tamper protection is on, those changes require going through proper management channels, not just registry edits or local configuration.

This is where most people f* up. They find a noisy alert caused by a line-of-business application and someone adds C:\ to the exclusion list to stop the noise. Tamper protection off means nothing stops that change from happening silently and permanently.
I have found exclusions that cover entire system drives sitting untouched for years in production environments. Nobody added them through a managed policy. Someone typed them in locally to fix a ticket and forgot about them.
Funnily enough, a lot of companies that are presenting "secure" tooling for Windows, when showcasing, are disabling tamper protection to make the system look more vulnerable and try to scare you into buying something. The fact is that disabling the tampering protection from a local device has been proven to be really hard to achieve.
Enable tamper protection. If it breaks your legacy management scripts, fix the scripts. That is the right answer.
Custom Network Indicators: Your Threat Intel Actually Does Something
Custom network indicators push allow or block decisions for specific IPs, domains, or URLs directly onto your endpoint fleet via the network protection layer.
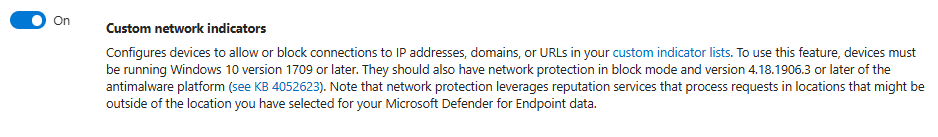
This is operationally useful when you have threat intel that is more current than Microsoft's classifications. A new command and control domain identified in your threat hunting goes onto the block list and is enforced on every managed device within a short timeframe.
Two things to get right before you rely on this. First, network protection must be in block mode on your endpoints, not audit. Block indicators do nothing in audit mode. Second, build a proper workflow: who can add indicators, for what time period, and what is the review process. Badly scoped indicators blocking legitimate services is a real operational risk.
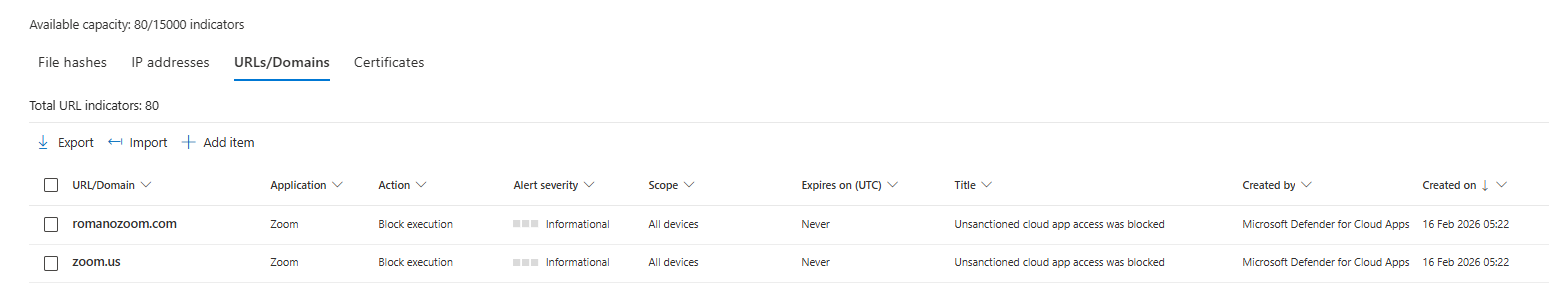
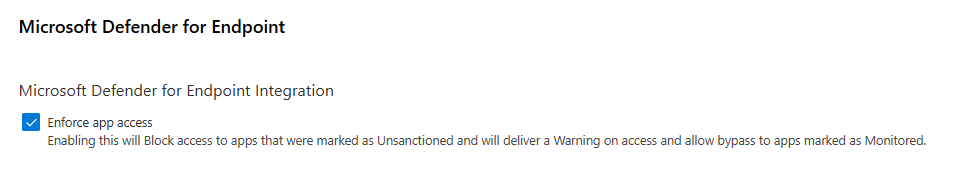
Another great thing in here is that if you have an Unsanctioned application in Defender for Cloud, it will auto-add its domains to this list. Just ensure you have this option enabled in Cloud apps.
Web Content Filtering: Built-In Blocking Nobody Uses
Web content filtering lives under Settings > Endpoints > Web content filtering. You define category-based policies and assign them to device groups. The blocking runs through network protection. No extra agent, no proxy deployment, nothing else required.
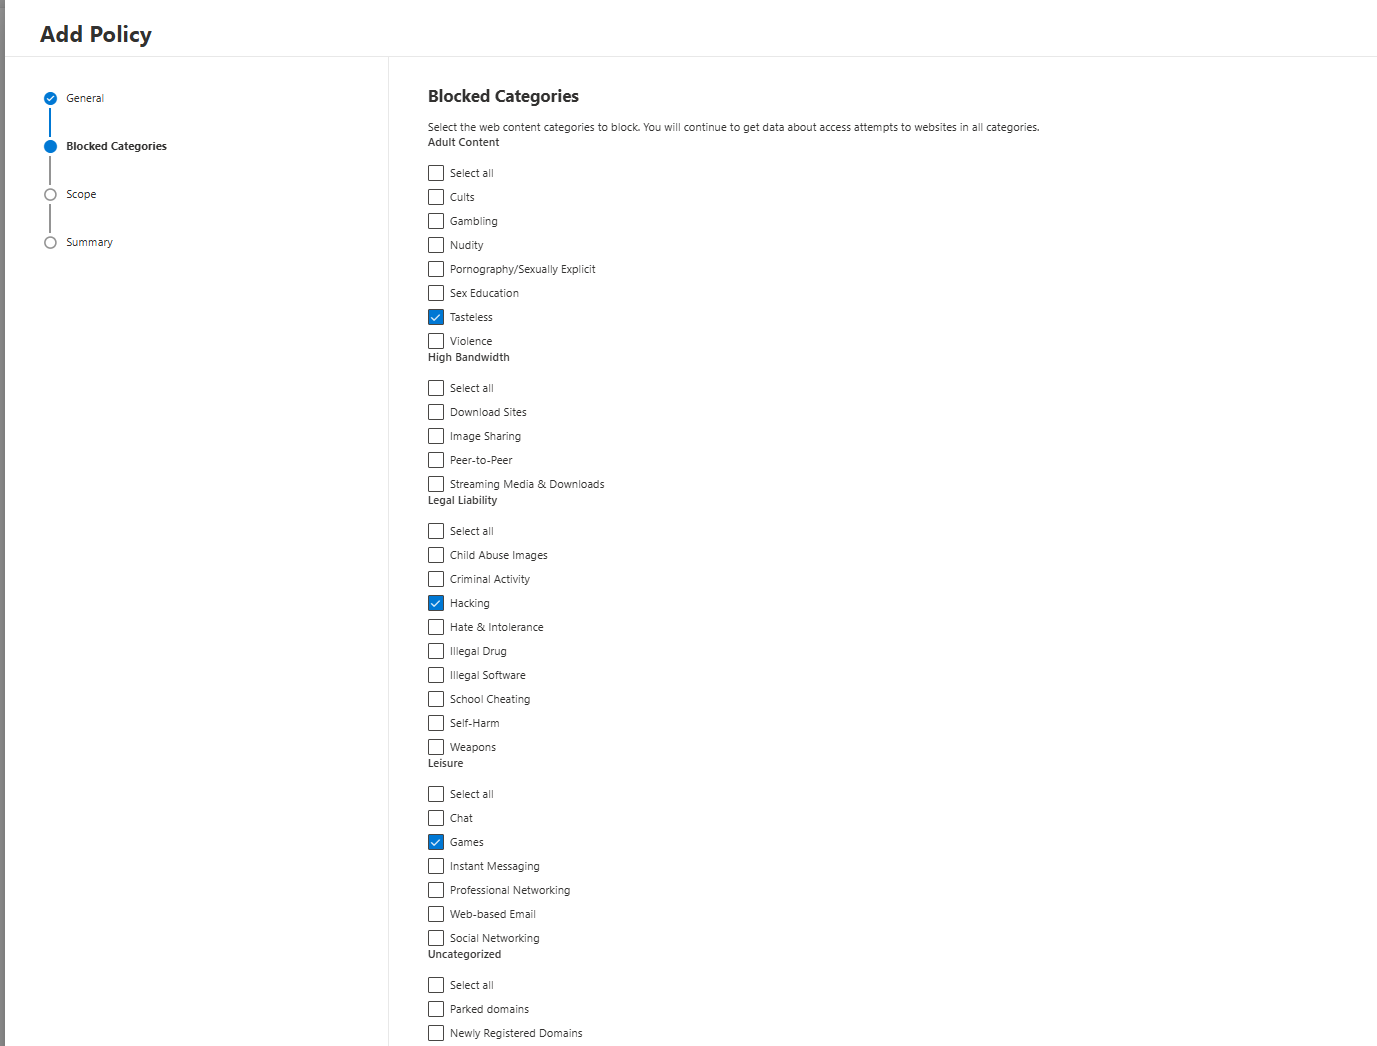
You can have different policies per machine group. Executives get a slightly more permissive policy because they will complain. Shared kiosk devices get aggressive blocking. Developer groups get exceptions for package repositories. Standard users get something in the middle.
The built-in categories cover Adult Content, High Bandwidth, Legal Liability, Leisure, and Uncategorised. Even if you only block Legal Liability across the board, that is a meaningful reduction in risk.
Automation Uploads: Double Scanning Is A No-Brainer
Under Settings > Endpoints > Automation uploads you have two options: File Content Analysis and Memory Content Analysis.
File Content Analysis sends suspicious files from automated investigations to Microsoft's cloud for deeper inspection based on file extension. Memory Content Analysis uploads process memory during automated investigations.
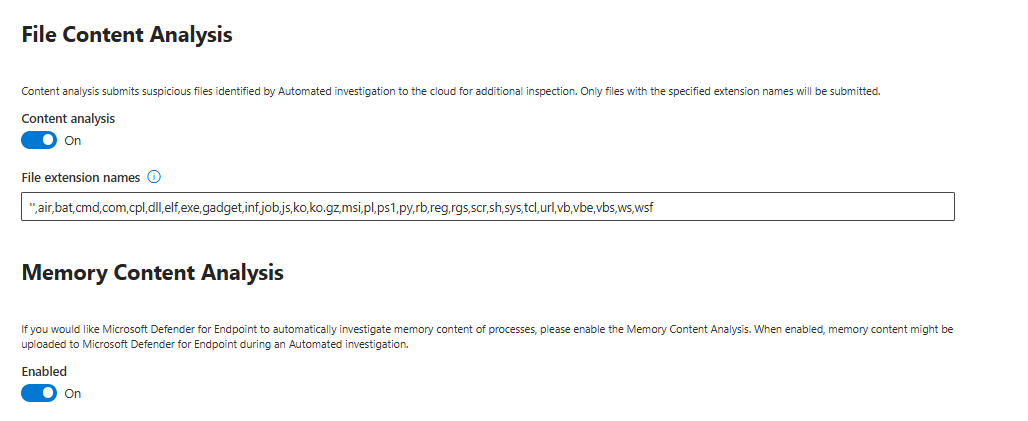
Both should be on.
The reason is simple. Automated investigation makes decisions based on local heuristics plus whatever context the cloud analysis provides. With these off, the investigation is working with less information. With them on, a malware sample that has never been seen in your environment but matches cloud signatures gets caught at the investigation stage rather than being missed because the local analysis had no reference.
The privacy conversation is real. Memory content from production servers does go to Microsoft. If you are in a highly regulated environment, run this past your legal and compliance team first and consider adjusting the extension list to exclude obviously sensitive file types. But for most organisations, the security value outweighs the privacy concern.
Enterprise IoT: The Printers Have Been Watching You
Under Settings > Device discovery > Enterprise IoT, there is a toggle that adds IoT visibility through Defender for IoT. Enable it and Defender starts surfacing vulnerability data and security recommendations for unmanaged IoT devices on your network: printers, cameras, VOIP phones, smart TVs.
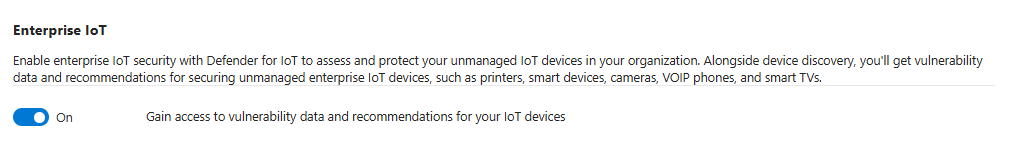
These devices are almost never managed, rarely patched, and permanently connected to your corporate network. They have default credentials, old firmware, and usually no one who owns them from a security perspective. They are also on the same network segments as your servers.
Turn this on and look at what appears. Then figure out who actually owns those devices before you try to do anything with the recommendations, because facilities teams and IT teams arguing about who owns the printer is always more complicated than the security findings.
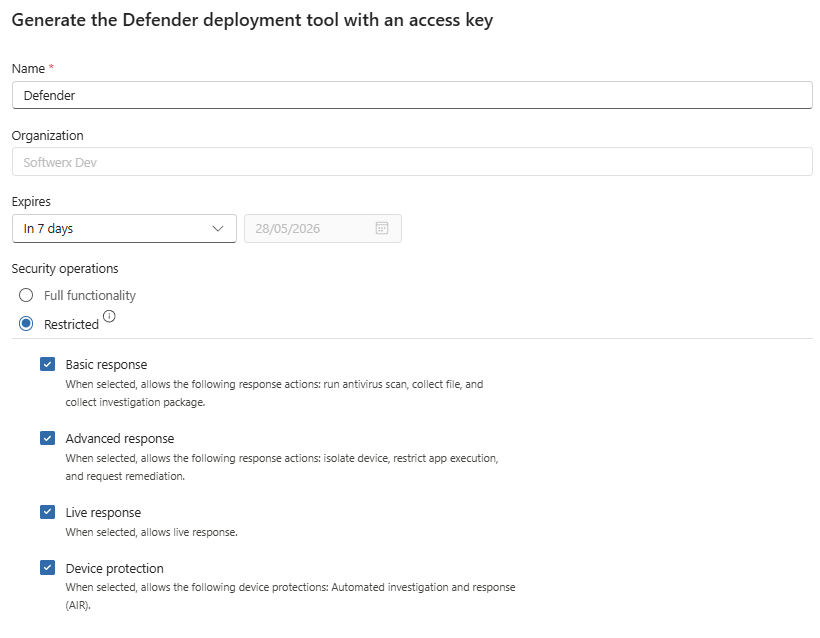
Isolation Exclusion Rules: Plan These Before You Ever Hit Isolate
Isolation exclusion rules let you define what stays reachable when a device is put into network isolation. You can allow specific IPs, process paths, or services.
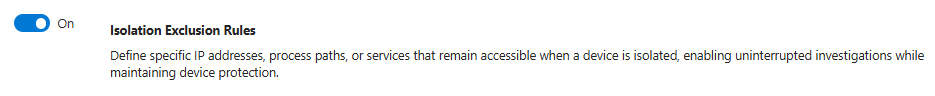
Why this matters: at 2am during a ransomware incident, you isolate a domain controller. If you have not pre-configured exclusions, you have just locked yourself out of the machine you need to investigate most urgently. You can still access it from the live response (if enabled), but critical services (to you) may not be able to communicate.
Build these now, before you ever need them. Keep the list as short as possible. You also have a new fantastic option now to generate a custom Defender deployment for your most critical assets.
Live Response: The Best Feature And The Easiest Way To Cause Problems
Live Response gives authorised analysts a remote shell into endpoints directly from the Defender portal. There is a separate toggle for servers.
This is genuinely excellent for incident response. You can grab running processes, pull files, kill processes, run investigation scripts, and collect artefacts without waiting for someone to share a screen or grant remote access through a separate tool.
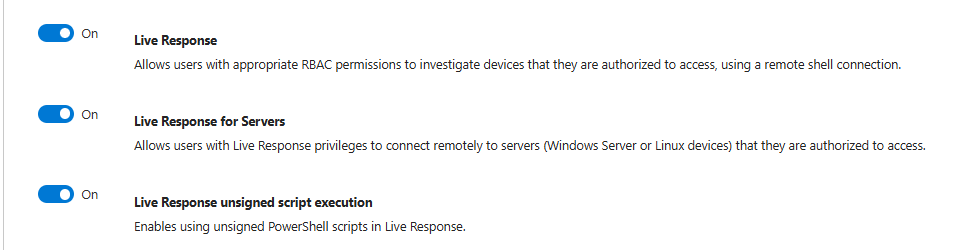
The unsigned PowerShell script toggle should stay off for almost everyone. If you need it, restrict it to two or three senior analysts who understand the implications.
The operational requirement that most people skip: every Live Response session should be logged and reviewed. What commands were run, what files were pulled, what was changed. If you deploy Live Response without a process around audit and review, you have given your SOC unlimited access to production machines with no accountability layer. Build the process before you enable the feature.
Authenticated Telemetry: Just Leave It On
Authenticated telemetry requires Defender to use authenticated channels for uploading telemetry data, which prevents an attacker from spoofing fake telemetry into your dashboard.

Leave it on.
PUA Remediation: Stop Letting Junk Accumulate
Potentially unwanted applications sit in the grey zone between clean and malicious. Adware, bundled toolbars, shady browser extensions, download managers that do too much. With Always remediate PUA on, Defender removes them instead of just telling you they exist.

Enable it. If you have a specific application that gets flagged incorrectly, add an exclusion for that application. Do not leave the whole PUA class unhandled because one legitimate tool gets caught.
Microsoft Intune Connection: Wire These Up
The Intune connection shares device information bidirectionally. Intune can consume Defender's risk assessment to enforce conditional access. Defender can consume Intune's compliance state to get a fuller picture of device health.
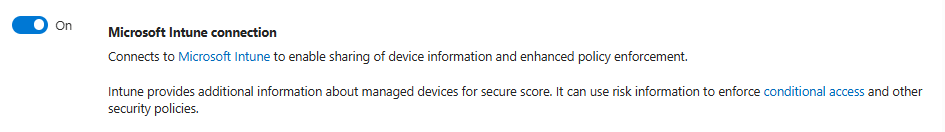
If you use Intune (you should!), enable this. The Secure Score improvements that come from Intune device compliance feeding into Defender's posture visibility are meaningful, and the conditional access integration is how you stop a high-risk device from accessing sensitive resources without a separate policy engine.
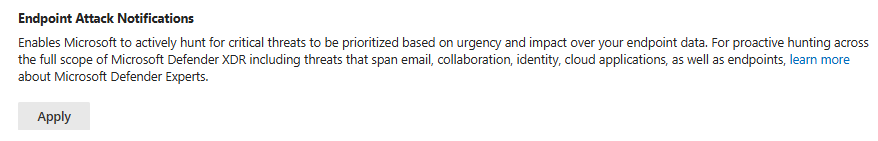
Endpoint Attack Notifications: Free Second Set of Eyes
Endpoint Attack Notifications mean that Microsoft's threat hunters can proactively notify you when they see something serious based on your telemetry. It's NOT a free service, and it's sold separately from any other XDR products. Most likely, there is no reason for you to apply.
Streamlined Connectivity: Good Architecture, Painful Rollout If You Rush It
Streamlined connectivity reduces the number of endpoints Defender talks to, collapsing communication to fewer domains and static IPs. Microsoft is building future features on this model.
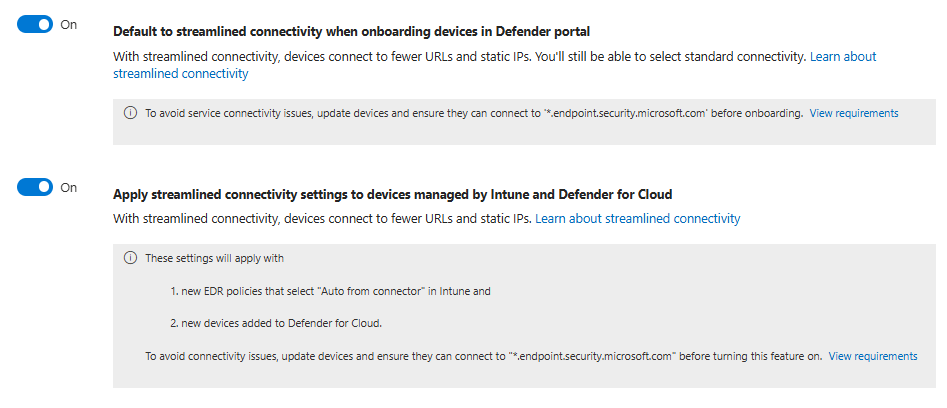
The rollout catches people out. If you enable this before confirming that your devices can actually reach the new domain pattern, onboarding breaks silently. Devices drop off the map without clear error messages.
Test from representative networks first. Update firewall rules. Then turn it on for a pilot group. Treat it like a change with a proper rollout plan.
Aggregated Reporting: More Signal, Better Investigations
Aggregated reporting changes how Defender handles repeating events that would normally get deduplicated or dropped entirely due to low individual information value. With it on, you get summary records for patterns that would otherwise be silently filtered out.
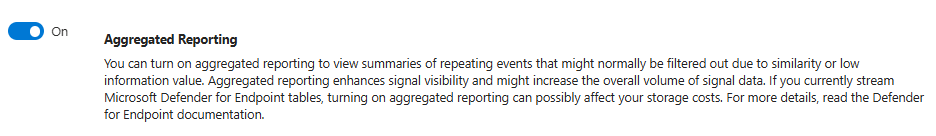
Think about it this way. Without aggregated reporting, if the same connection attempt fires fifty times in an hour, Defender collapses it and you see one event or nothing at all. With aggregated reporting on, you get a summary that tells you the pattern happened, how many times, and across which scope. That volume data matters. A single failed authentication is noise. Five hundred failed authentications from the same process in an hour is a detection.
Enable it. Review the cost impact after a week. In almost every environment I have seen, the detection and hunting value is worth it.
XDR Asset Rule Management: Your Incident Response Depends On This
Asset rule management under Settings > Microsoft Defender XDR lets you create rules that tag devices or apply criticality classifications based on attributes.
I cannot stress this enough: set this up now. When you (or more importantly, your SOC) are working a serious incident at midnight and you need to know instantly whether the affected machine is a lab box or a production domain controller, asset tags are the difference between knowing immediately and spending ten minutes asking around in a Teams channel.
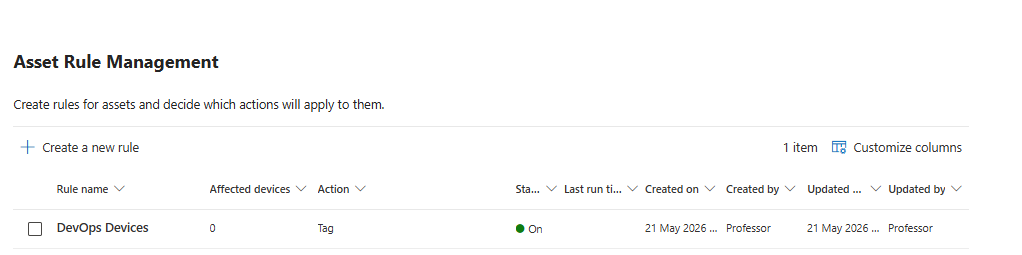
Start simple. Tag domain controllers. Tag critical application servers. Tag privileged workstations. Tag jump hosts. You can refine over time but getting those first classifications in place takes an afternoon and saves you real hours when it matters.
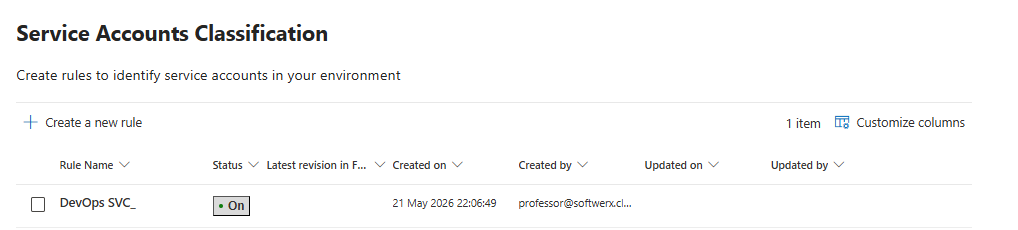
Service account classification sits in the same settings area. Create rules to identify your service accounts so that your identity analytics do not build baselines that confuse service principals with user activity. UEBA anomaly quality goes up significantly once service accounts are properly classified out of the user baseline.
Incident Correlation: Helpful Until It Is Not
The incident correlation default under Settings > XDR > Incident correlation controls whether Defender tries to group related alerts across products into a single incident (it's off by default)
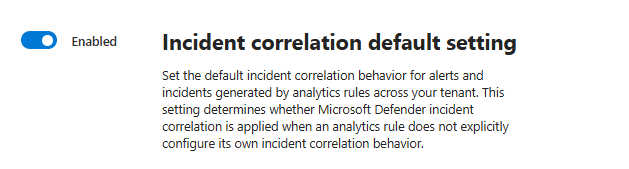
When it works well, it is excellent. An attacker moves from a phishing email through identity and onto an endpoint and the whole thing lands in one incident with a connected timeline. That is genuinely useful.
When it works badly, it sticks unrelated alerts together because they share a device or a user. You end up with a forty-alert monster incident covering three separate security test activities and one real event. Analysts spend more time untangling the grouping logic than investigating the actual alerts.
My honest take: leave it on and tune per-rule. Sentinel analytics rules can configure their own correlation behaviour explicitly, which overrides the default. Use that for rules where you know grouping causes problems. The global default is worth having for the cases where correlation is good.
Critical Asset Management: This Is Not Optional
Critical asset management under Settings > XDR > Critical asset management is mandatory for any SOC that wants incident response to mean something.
When ransomware hits and you have thirty devices encrypted, the fact that one of them is your primary domain controller should immediately change your response priority and escalation. Without critical asset classifications, your incident screen shows you a list of hostnames sorted by alert count. With them, you see which of those hostnames matters most.
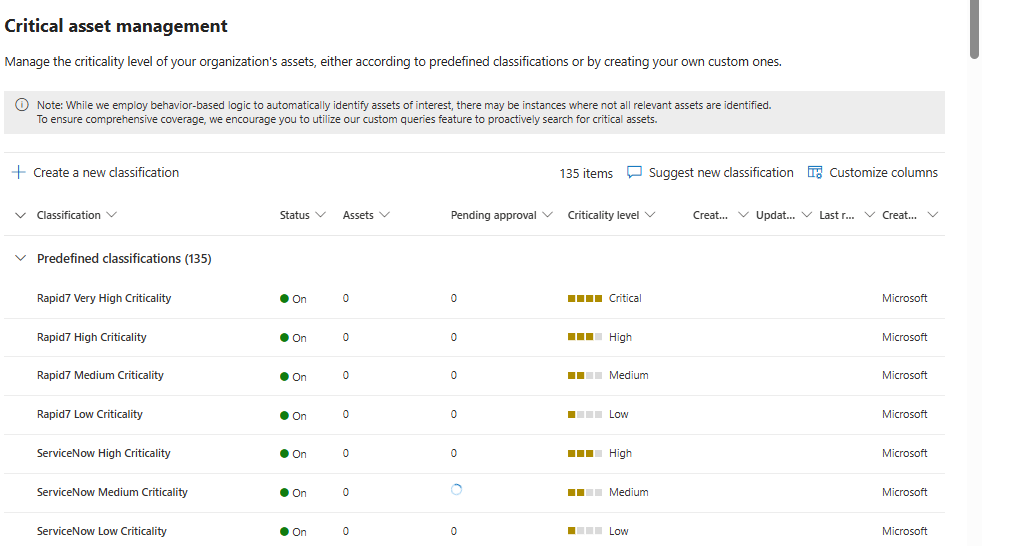
I have a separate post planned specifically for critical asset management. Short version: spend an afternoon classifying your domain controllers, critical servers, privileged workstations, key identities, and important cloud resources. Your incidents, risk posture dashboard, and attack path analysis all immediately become more actionable.
Security For AI Agents: Watch This, Don't Bet On It Yet
Security for AI agents is in preview. It connects Copilot Studio agents and Microsoft Foundry workloads to Defender for monitoring, inventory, posture recommendations, and runtime alerts for things like prompt injection, data leakage, and suspicious agent behaviours.
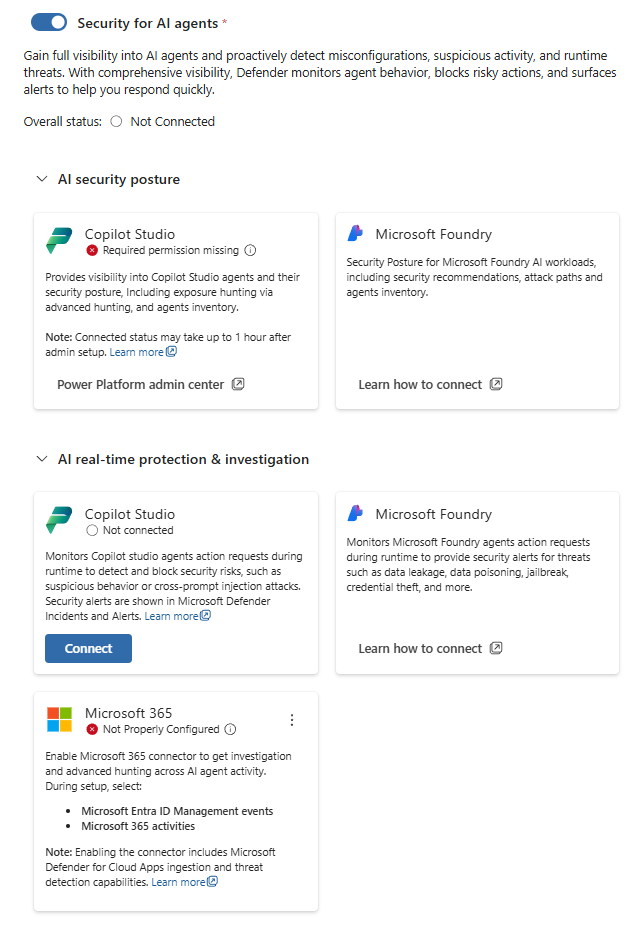
The Defender portal already shows a warning: from July 2026, you will need a Microsoft Agent 365 subscription to keep using agent inventory and other capabilities that fall under that licence tier. Microsoft announced Agent 365 as generally available in May 2026. It is bundled into higher tier licences or available standalone.
If you are already building internal Copilot Studio agents or using Foundry workloads, turn on the monitoring now and get familiar with what it surfaces. The runtime alerts for cross-prompt injection are real detections, not just posture checks.
If your AI story is still mostly people pasting data into ChatGPT from personal devices, this feature is not the thing to focus on. Sort out shadow AI visibility through Defender for Cloud Apps and network controls first.
Settings I Would Enable Immediately
These have a strong security return with low operational risk:
- Defender for Cloud Apps integration
- EDR in block mode after a short pilot
- Tamper protection
- Device discovery in Standard mode for all devices
- Web content filtering starting in report mode
- Automation uploads for both file and memory content analysis
- PUA remediation
- Authenticated telemetry
- Aggregated reporting
- Endpoint attack notifications
- Enterprise IoT
- Intune connection if you use Intune
- Isolation exclusion rules
Settings I Would Test First Before Going Global
These are good but have real operational impact if you get them wrong:
- Custom network indicators - build the workflow before you start adding indicators
- Live Response on servers - sort out your audit and review process first
- Streamlined connectivity - proper change management and firewall validation required
- Web content filtering - test against a smaller group of the devices first
You already paid for all of this. Start using it.
Class dismissed.