Your Sentinel Detection Setup Is Probably Broken. Here's How to Know.

All right class
Most environments running Sentinel today have the same problem. The toggle is on. Rules are firing. UEBA is enabled. And nobody trusts any of it.
Two hundred analytic rules, half of them out-of-the-box templates nobody has touched since deployment, and the SOC is numb from alert fatigue. The anomaly table is flooding. Analysts are closing incidents on gut feel. And somewhere in that noise, real threats are getting missed.
This is not a guide on how to configure features. It is an honest breakdown of how detection actually matures in Sentinel, what breaks at each stage, and what you need to fix before you move on.
Three layers. Basic, Intermediate, Expert.
Layer 1: Basic Detection
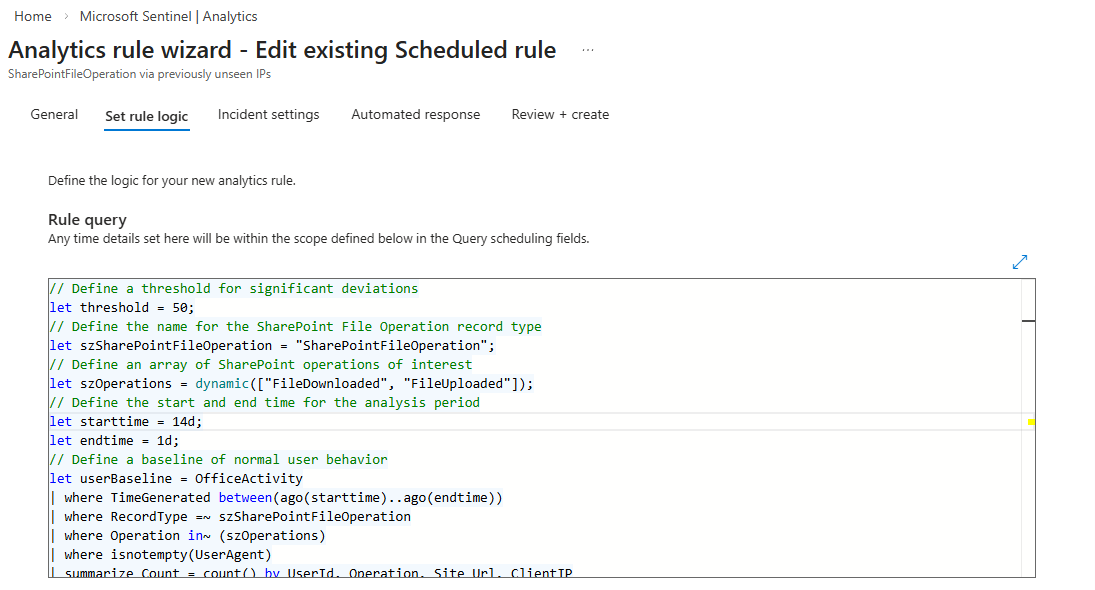
Scheduled analytics rules and NRT rules running KQL against raw log tables with fixed thresholds. SecurityEvent, SigninLogs, OfficeActivity, DeviceProcessEvents. If this happens X times in Y minutes, alert.
This is not the boring layer. This is the layer where most environments are broken and do not know it, because the rules are "on" but nobody validated that they are doing what they think.
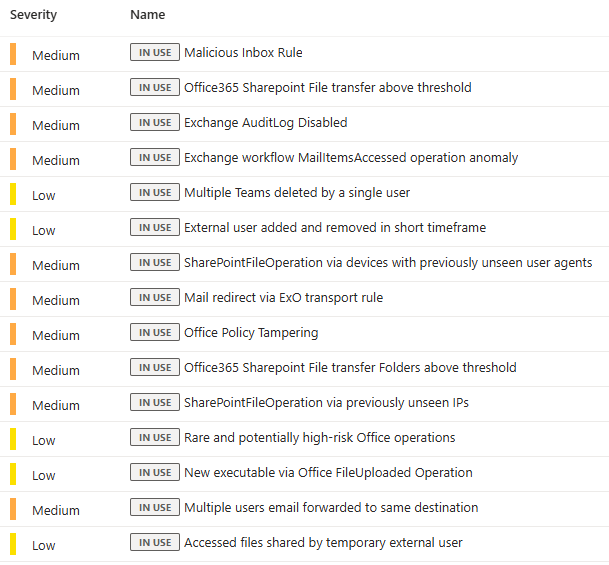
Start from Content Hub templates. They are written by Microsoft security teams against real telemetry, they carry MITRE mappings, and entity mappings are pre-configured. The mistake everyone makes is enabling eighty of them in one go, getting flooded, and then disabling entire rule categories. That is not tuning. That is giving up.
Enable in batches. Around ten rules at a time (you can use the test environment if you have access to it, which makes it much easier) or enable by Source. Let them run for some time (ideally a week). Review what fires. Tune the thresholds for your environment. Document what you changed and why. Then do the next batch. This is not glamorous work but it is the only way you end up with a ruleset you actually trust.
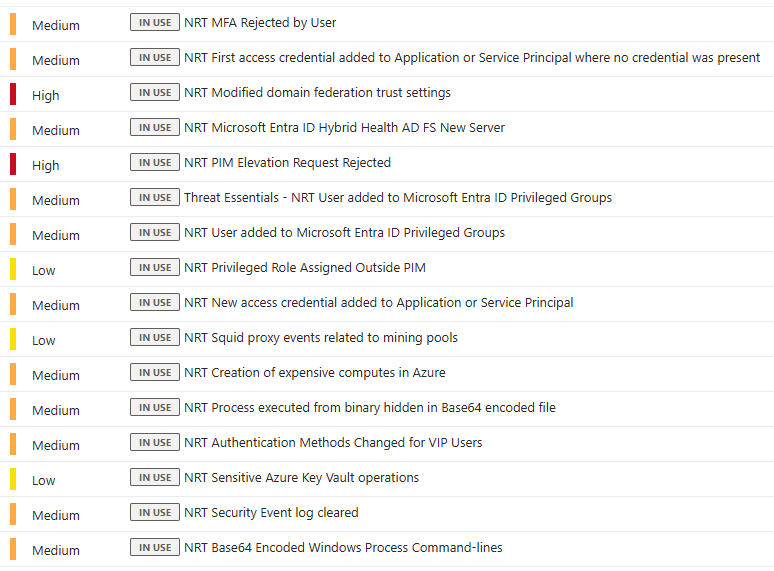
NRT rules are for latency-sensitive detections only. They run every minute with roughly a two-minute ingestion delay. Use them for mass privilege changes, admin lockouts, things where a five-minute scheduled window genuinely makes a difference. Do not use them for everything. They carry a resource cost and the latency advantage disappears for anything where timing does not matter.
You Need Automation at Layer 1. Not Later.
This is where the response gap starts. An analyst opens a fresh incident and sees five raw events with zero context. No TI lookups. No entity enrichment. They spend twenty minutes manually finding information that should have been injected automatically before they even open the queue.
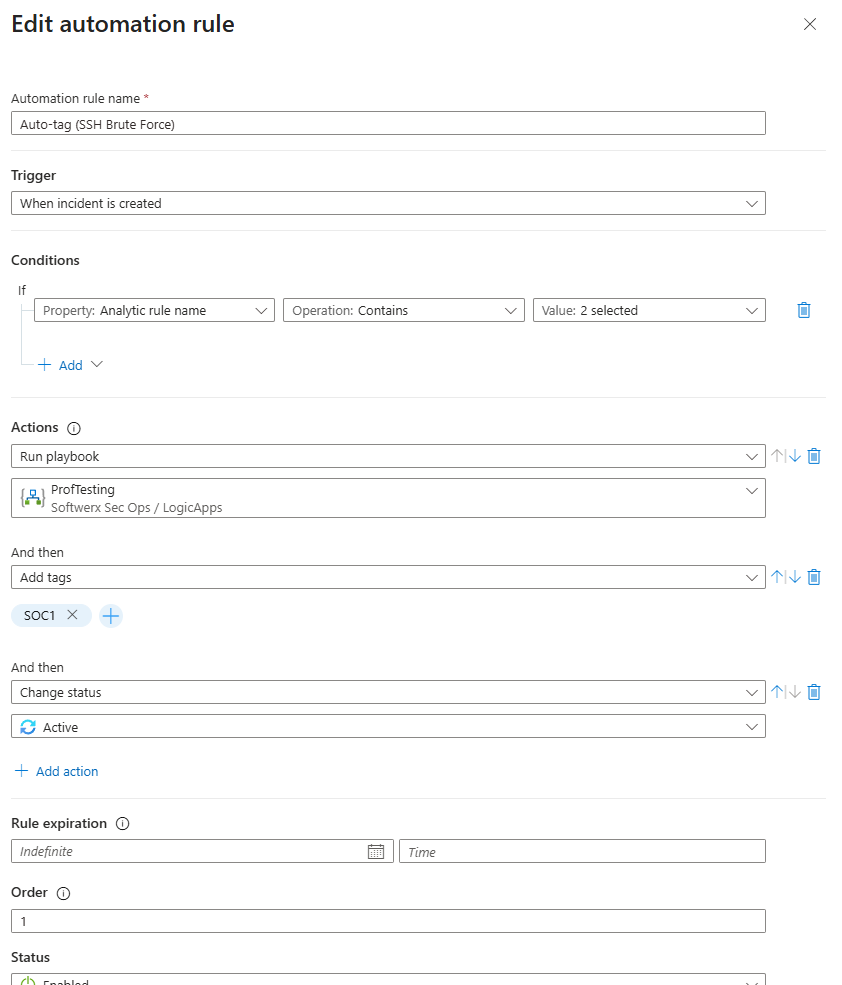
Automation Rules handle the lightweight, no-code stuff. Use them straight away.
- Auto-tag severity based on rule name patterns
- Suppress incidents from known maintenance windows during change periods
- Auto-close incidents generated by expected activity (and double-check it)
Enrichment can be done really easily by connecting IP addresses seen in the various Analytic Rules to the Microsoft TI (or any other vendors like VirusTotal - though that would be via Logic Application), example below: I am merging the Singinlogs table together with ThreatIntelIndicators to check if I had any logins from addresses listed in the IOCs.
let TI_NetworkIOCs = ThreatIntelIndicators
    | where ObservableKey == "network-traffic:src_ref.value"
    | where IsActive == true
    | where Revoked == false
    | where ValidUntil > now()
    | summarize
        TI_Description    = any(tostring(parse_json(Data).description)),
        TI_Name           = any(tostring(parse_json(Data).name)),
        TI_ThreatType     = any(tostring(parse_json(Data).indicator_types[0])),
        TI_Confidence     = max(Confidence),
        TI_Tags           = any(Tags),
        TI_TLPLevel       = any(tostring(parse_json(AdditionalFields).TLPLevel)),
        TI_Source         = any(SourceSystem),
        TI_ValidFrom      = min(ValidFrom),
        TI_ValidUntil     = max(ValidUntil),
        TI_IndicatorCount = count()
        by TI_IP = ObservableValue;
SigninLogs
| where TimeGenerated > ago(7d)
| extend
    City            = tostring(parse_json(LocationDetails).city),
    State           = tostring(parse_json(LocationDetails).state),
    Country         = tostring(parse_json(LocationDetails).countryOrRegion),
    DeviceOS        = tostring(parse_json(DeviceDetail).operatingSystem),
    DeviceBrowser   = tostring(parse_json(DeviceDetail).browser),
    IsCompliant     = tostring(parse_json(DeviceDetail).isCompliant),
    IsManaged       = tostring(parse_json(DeviceDetail).isManaged),
    SignInResult    = iff(ResultType == 0, "Success", strcat("Failure (", tostring(ResultType), ")"))
| lookup kind=leftouter TI_NetworkIOCs on $left.IPAddress == $right.TI_IP
| extend
    TI_Match    = isnotempty(TI_Source),
    TI_Severity = case(
        isnotempty(TI_Source) and TI_Confidence >= 80, "High",
        isnotempty(TI_Source) and TI_Confidence >= 50, "Medium",
        isnotempty(TI_Source),                          "Low",
        "Not Flagged"
    )
| project
    TimeGenerated,
    UserPrincipalName,
    UserDisplayName,
    UserType,
    IPAddress,
    City,
    State,
    Country,
    AppDisplayName,
    ClientAppUsed,
    SignInResult,
    DeviceOS,
    DeviceBrowser,
    IsCompliant,
    IsManaged,
    AuthenticationRequirement,
    ConditionalAccessStatus,
    RiskLevelDuringSignIn,
    RiskLevelAggregated,
    TI_Match,
    TI_Severity,
    TI_Confidence,
    TI_ThreatType,
    TI_Name,
    TI_Description,
    TI_Tags,
    TI_TLPLevel,
    TI_Source,
    TI_ValidFrom,
    TI_ValidUntil,
    TI_IndicatorCount
| order by TI_Match desc, TI_Confidence desc, TimeGenerated desc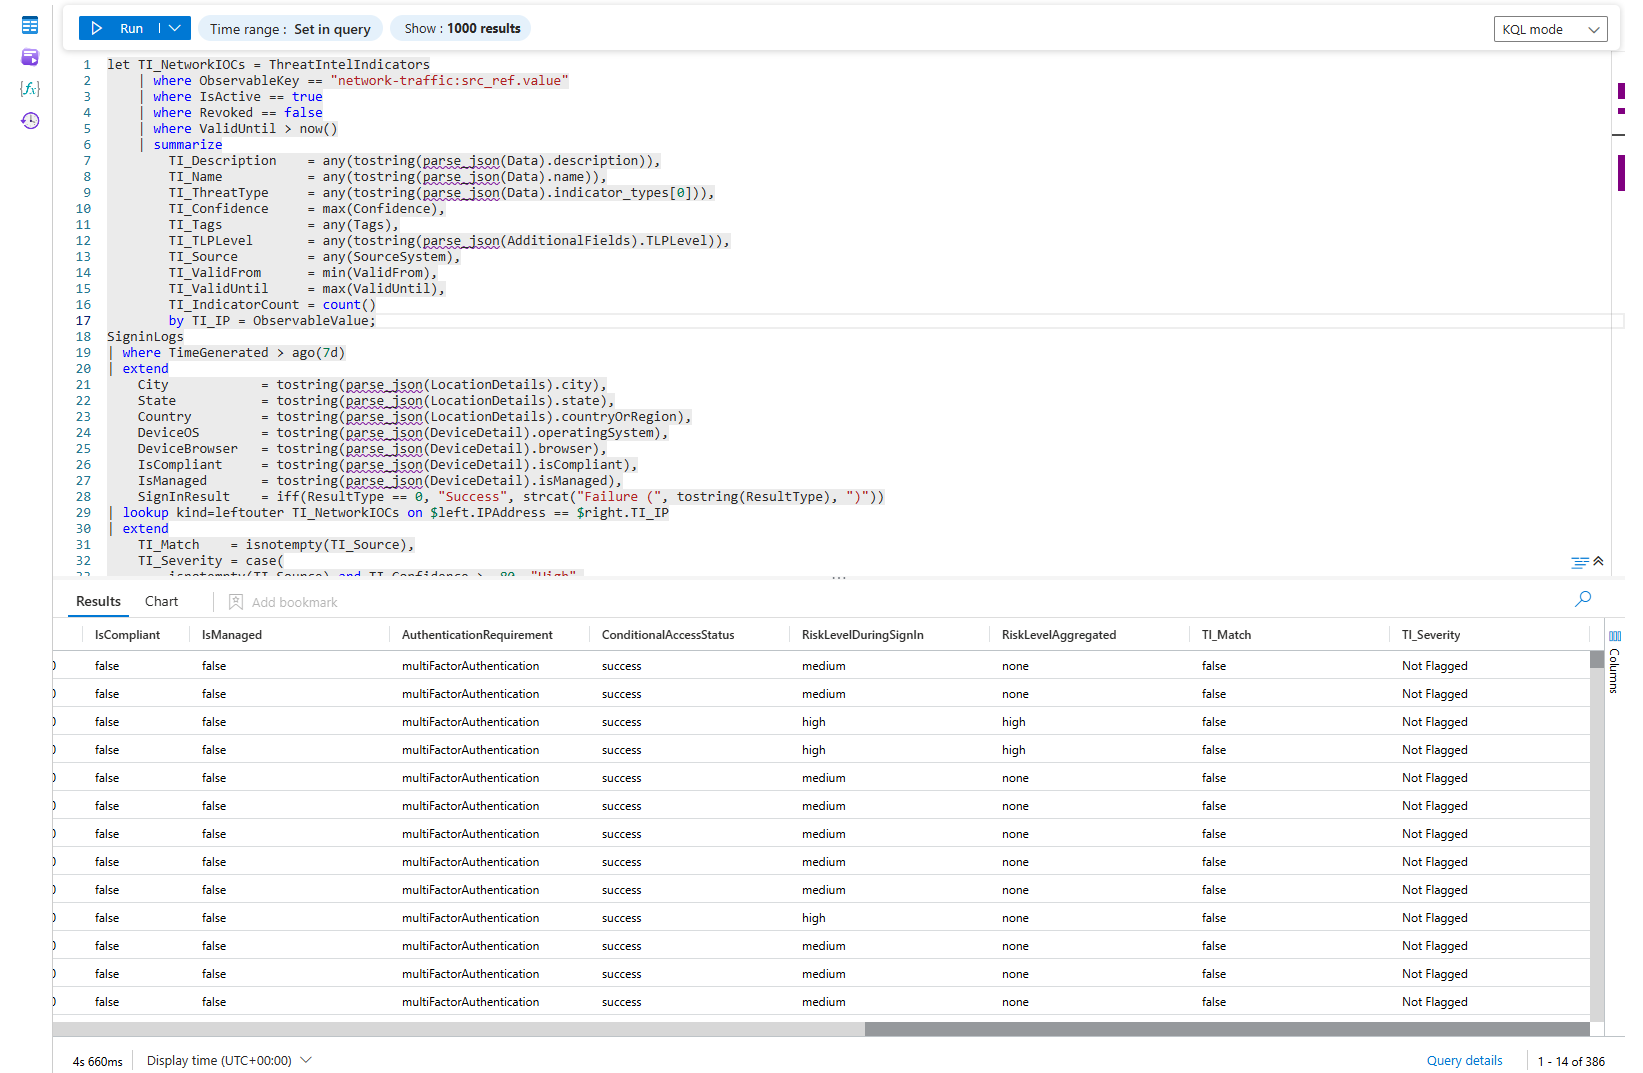
There is no reason not to have it running against a lot of incidents that natively contain IP addresses in the Entities list. You may of course start bit* about TI having native analytic rules already in Sentinel, or the fact that you can look at those IPs already in the GUI. But, do you have all of the scenarios covered with the TI Analytic Rules? How long does it take you to look at the IP addresses in the GUI when you have 50 of them listed in one incident?
You are at Layer 1 and not yet stable if:
- Rules have been live for three or more months with no false positive review
- Analysts are looking up TI and entity context manually during triage
- You do not know which of your active rules actually fired in the last 30 days
Layer 2: Intermediate Detection
The shift here is conceptual. A failed login from a standard user who mistyped their password is not the same event as a failed login from your Exchange admin at 2am from a country they have never logged in from before. A static rule treats them identically. That is the problem you are solving at this layer.
Intermediate detection binds your alerts to context. Who is the entity. What are they normally allowed to do. Does any of this match known threat intelligence. What else happened before or after.
Entity-enriched rules join against IdentityInfo inside the query itself where possible.
let HistoricalBaseline = SigninLogs
    | where TimeGenerated between (ago(90d) .. ago(1d))
    | where ResultType == 0
    | extend Country = tostring(parse_json(LocationDetails).countryOrRegion)
    | where isnotempty(Country)
    | summarize
        KnownCountries = make_set(Country),
        KnownIPs       = make_set(IPAddress, 50)
        by UserPrincipalName;
let PrivilegedUsers = IdentityInfo
    | where TimeGenerated > ago(30d)
    | summarize arg_max(TimeGenerated, *) by AccountUPN
    | where AssignedRoles has_any ("GlobalAdmin", "SecurityAdmin", "PrivilegedRoleAdmin",
                                   "ExchangeAdmin", "SharePointAdmin", "UserAdmin",
                                   "AuthenticationAdmin", "ConditionalAccessAdmin")
    | project
        AccountUPN,
        AssignedRoles   = tostring(AssignedRoles),
        Department,
        IsMFARegistered,
        EntityRiskScore = tostring(EntityRiskScore);
let TI_NetworkIOCs = ThreatIntelIndicators
    | where TimeGenerated > ago(7d)
    | where ObservableKey == "network-traffic:src_ref.value"
    | where IsActive == true
    | where Revoked == false
    | where ValidUntil > now()
    | summarize
        TI_Description = any(tostring(parse_json(Data).description)),
        TI_ThreatType  = any(tostring(parse_json(Data).indicator_types[0])),
        TI_Confidence  = max(Confidence),
        TI_Tags        = any(Tags)
        by TI_IP = ObservableValue;
let RiskyFailureCodes = dynamic([50053, 50055, 50126, 50057, 50144, 50056]);
SigninLogs
| where TimeGenerated > ago(1d)
| where ResultType in (RiskyFailureCodes)
| extend
    Country = tostring(parse_json(LocationDetails).countryOrRegion),
    City    = tostring(parse_json(LocationDetails).city)
| join kind=inner PrivilegedUsers on $left.UserPrincipalName == $right.AccountUPN
| lookup kind=leftouter HistoricalBaseline on UserPrincipalName
| lookup kind=leftouter TI_NetworkIOCs on $left.IPAddress == $right.TI_IP
| extend
    IsNewCountry = isnotempty(Country) and not(set_has_element(KnownCountries, Country)),
    IsNewIP      = not(set_has_element(KnownIPs, IPAddress)),
    TI_Match     = isnotempty(TI_ThreatType)
| where IsNewCountry == true or TI_Match == true
| summarize
    FailedAttempts    = count(),
    FirstAttempt      = min(TimeGenerated),
    LastAttempt       = max(TimeGenerated),
    DistinctIPs       = dcount(IPAddress),
    DistinctCountries = dcount(Country),
    IPList            = make_set(IPAddress, 10),
    CountryList       = make_set(Country, 10),
    ErrorCodes        = make_set(ResultType, 10),
    AppList           = make_set(AppDisplayName, 10),
    NewCountryFlag    = max(IsNewCountry),
    NewIPFlag         = max(IsNewIP),
    TI_Matched        = max(TI_Match),
    TI_ThreatTypes    = make_set(TI_ThreatType, 5),
    TI_MaxConfidence  = max(TI_Confidence),
    TI_Descriptions   = make_set(TI_Description, 5),
    KnownCountries    = any(KnownCountries)
    by UserPrincipalName, AssignedRoles, Department, IsMFARegistered, EntityRiskScore
| extend Severity = case(
    TI_Matched == 1 and NewCountryFlag == 1,  "Critical",
    TI_Matched == 1,                          "High",
    NewCountryFlag == 1 and FailedAttempts > 5,"High",
    NewCountryFlag == 1,                      "Medium",
    "Low"
)
| project
    UserPrincipalName,
    AssignedRoles,
    Department,
    IsMFARegistered,
    EntityRiskScore,
    Severity,
    NewCountryFlag,
    NewIPFlag,
    KnownCountries,
    FailedAttempts,
    DistinctIPs,
    DistinctCountries,
    FirstAttempt,
    LastAttempt,
    TI_Matched,
    TI_ThreatTypes,
    TI_MaxConfidence,
    TI_Descriptions,
    IPList,
    CountryList,
    ErrorCodes,
    AppList
| order by Severity asc, TI_Matched desc, NewCountryFlag desc, FailedAttempts desc
Same failed login threshold. Fires only for privileged accounts. The noise from the rest of the org disappears. When it does fire, it means something.
Multi-signal scenario rules are where this layer gets genuinely interesting. You stop asking "did this one thing happen" and start asking "did this sequence of things happen." An external forwarding rule was created, and a mass SharePoint download, and a first-time login from a new country, all within two hours, all the same user. Each event alone is noise. Time-window joins in KQL handle this. If you are comfortable with the language (or your AI is ^^), it is within reach.
Automation at Layer 2
Static automation rules do not cut it anymore. You want Logic Apps that pull context on demand when an incident fires.
An enrichment playbook/KQL at this layer does more than a TI lookup. It queries IdentityInfo for the affected account, pulls the manager name, checks last password reset and MFA change timestamps from the Entra audit log, checks whether the account has active Risky User flags from Identity Protection, and writes all of it back to the incident. An analyst should be able to make a triage decision in under two minutes. Build the playbook that makes that possible.
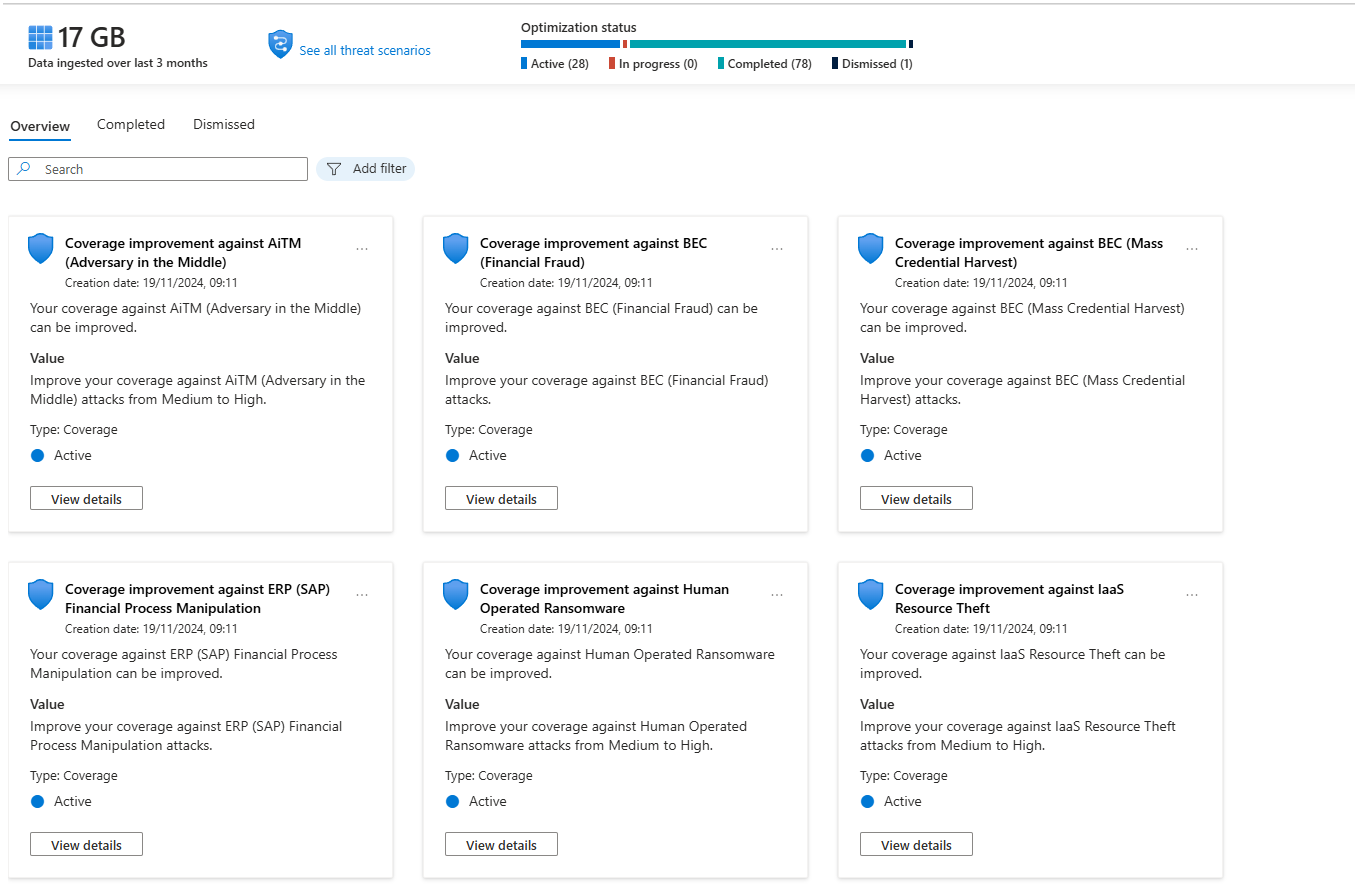
SOC Optimisation becomes a governance tool here, not an onboarding tool. Run the MITRE gap analysis monthly. Map your active rules against your ingested data sources. This is how you track your actual detection posture, not by counting how many rules are enabled.
You are at Layer 2 if:
- IdentityInfo is current and you are joining against it in your rules
- Enrichment playbooks/KQLs run automatically before analysts open incidents
- Your rules behave differently for privileged accounts than for standard users
- You are starting to have more custom/changed rules than base rule templates from the Content Hub
Layer 3: Expert - When Rules Stop Being Enough
Here is the honest thing about behavioural detection that nobody in vendor marketing will tell you. It is not always better than rules. It catches different things. Slow beaconing, living-off-the-land abuse, account compromise patterns that span weeks, insider behaviour that only looks wrong in aggregate. For those specific scenarios, UEBA and ML anomalies are genuinely the best option. For everything else, a well-tuned scheduled rule will outperform them.
What Is Actually Running Under the Hood
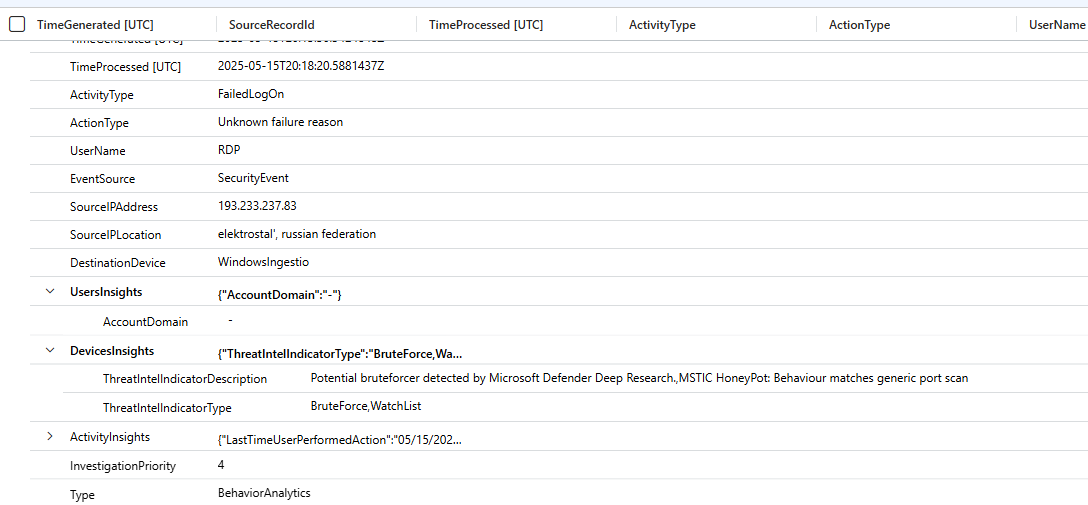
BehaviorAnalytics is the raw output table. Every event UEBA processes gets scored factoring in the user's own history, their peer group, time of day, location novelty, and resource sensitivity. InvestigationPriority is the composite risk score from 0 to 10 per entity.
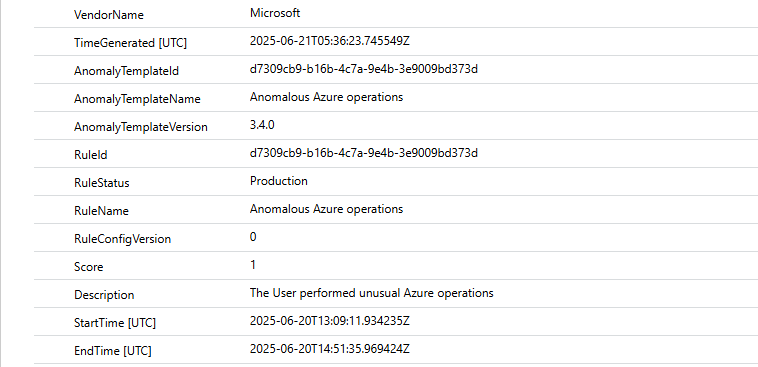
Anomalies is where Anomaly Analytics Rules write their findings. These are the ML models Microsoft ships, failed login volume per user, beaconing patterns, AWS CloudTrail volume anomalies, anomalous web responses. They are enabled by default and write to the Anomalies table independently of incident creation logic.
Worth knowing: the Behaviours Layer currently also covers non-Microsoft data sources. If you are multi-cloud with AWS, GCP, or Palo Alto, it is worth enabling and testing.
Query BehaviorAnalytics directly. Most teams never do, and they are missing the signal.
BehaviorAnalytics
| where TimeGenerated > ago(7d)
| where InvestigationPriority >= 8
| project
    TimeGenerated,
    UserName,
    UserPrincipalName,
    ActivityType,
    ActionType,
    UsersInsights,
    ActivityInsights,
    InvestigationPriority
| extend
    RiskScore  = todynamic(UsersInsights).UserRiskScore,
    Activity   = todynamic(ActivityInsights).ActivityType
| where UserPrincipalName !has "svc_"
| sort by InvestigationPriority desc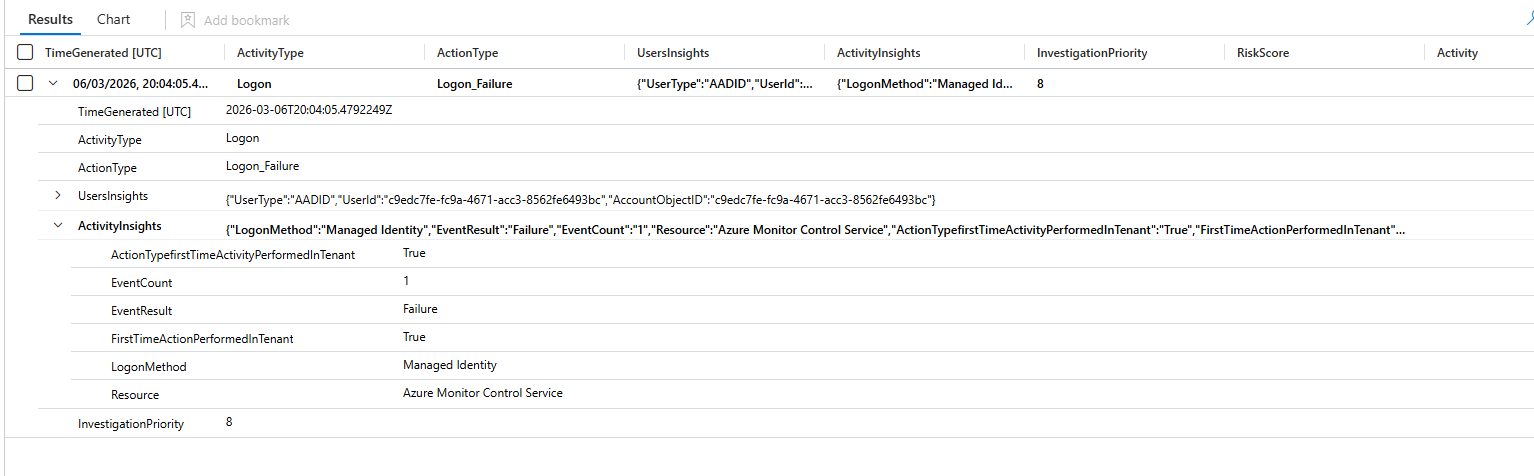
Run this weekly during your first 30 days of UEBA. Not to action everything. To learn what your environment's anomaly noise floor looks like before you wire it into incident creation.
Flighting Mode Is Non-Negotiable
This is where people make the mistake that kills analyst trust in behavioural detections permanently. They customise an anomaly rule, push it straight to production, and two days later the incident queue has 300 low-quality anomaly incidents. The SOC stops trusting anomaly detections entirely and you have lost months of work.
Flighting mode runs your tuned rule in parallel with the production version without creating incidents. You compare output over a week or two. You validate that the tuning actually improves signal quality. Then you promote to production. Every anomaly rule change goes through Flighting. No exceptions.
Automation at Layer 3
By this point, auto-remediation should be running for high-confidence, high-priority behavioural signals. An account with InvestigationPriority over 8 combined with anomalous credential access behaviour should trigger automatic Entra ID risky user confirmation, which cascades to a Conditional Access block. Confirmed C2 beaconing should auto-block the IP in Defender for Endpoint.
Microsoft has a Python-based SOAR framework in preview as of early 2026 that generates validated playbooks with flow diagrams from natural language descriptions. It is worth testing in a lab. Do not put preview-stage automation in front of your production containment workflows.
The Portal Migration: What You Actually Need to Know
Microsoft extended the Azure portal sunset for Sentinel to March 31, 2027. It was originally July 1, 2026, pushed after customer pressure, nearly nine months of extra runway.
The Defender portal is the long-term home. The unified incident queue across XDR and SIEM, Advanced Hunting across both simultaneously, SOC Optimisation covering both data sources, and Security Copilot. None of that is being backported to the Azure portal. New capabilities land in security.microsoft.com and nowhere else.
Plan the migration now. Do not wait until February 2027.
Where You Actually Are
| What you are seeing | What it means |
|---|---|
| IdentityInfo last updated over 14 days ago | Layer 0 failure, fix before anything else |
| Rules on but FP rates never reviewed | Layer 1, unstable |
| All Content Hub templates enabled at once | Layer 1, you gave up on tuning |
| NRT rules used for everything regardless of timing sensitivity | Layer 1, burning resource cost for no gain |
| Analysts manually looking up TI and entity context during triage | Layer 1, no automation |
| You do not know which active rules fired in the last 30 days | Layer 1, flying blind |
| No difference between admin and user alert thresholds | Stuck at Layer 1 |
| IdentityInfo is current and joined in your rules | Layer 2 functioning |
| TI enrichment running automatically against incident IP entities | Layer 2 functioning |
| Enrichment playbooks running before analysts open incidents | Layer 2 operational |
| More custom and tuned rules than unmodified Content Hub templates | Layer 2 operational |
| SOC Optimisation reviewed monthly as a governance exercise | Layer 2 mature |
| UEBA enabled but IdentityInfo is 30+ days stale | Layer 3 attempt, Layer 0 failure |
| Anomaly rules firing into Anomalies but never queried in hunting | Layer 3 enabled, not operational |
| BehaviorAnalytics queried regularly with InvestigationPriority thresholds | Layer 3 functioning |
| Auto-remediation wired to high-priority behavioural signals | Layer 3 operational |
| Flighting before every anomaly rule change, no exceptions | Genuinely at Layer 3 |
Most environments are at "Layer 1, partially tuned" and think they are at Layer 3 because the UEBA toggle is on. Turning on a feature is not the same as operating it.
Fix data quality first. Build automation at Layer 1 before you scale detection at Layer 2. Validate entity enrichment before you expect UEBA to be meaningful. The layers are sequential because each one depends on the previous one actually working.
Class dismissed