The Sentinel Data Lake Got Respecced: What Actually Moved to Fabric

All right class.
You moved your firewall logs to the data lake tier because the analytics bill had turned into a monthly argument with finance. You built a KQL job to push the interesting rows back into a _KQL_CL table, because my original data lake guide told you to. Maybe you wired a notebook into a detection. Or, like me in UK South, you spent months staring at a capacity message and never got that far.
On 23 September, the same day Microsoft announced ISOC, the data lake got a respec. Storage stayed exactly where it was. Interactive queries moved into Advanced Hunting. Jobs, notebooks and graphs moved out to Microsoft Fabric.
So did your build just get better, or did it just get deleted?
Both, depending on what you built. If the lake was a cheap shelf for logs you rarely open, this is a straight upgrade. If it was a workshop, the workshop's moved to a different building, and that building charges rent.
What the respec actually changed
There are now two data lakes, and a date decides which one you've got. You don't.
If you onboarded before 23 September, nothing's moved. You keep Data lake exploration in the Defender portal with its KQL queries, jobs and notebooks, and Microsoft says you can carry on with the existing documentation.
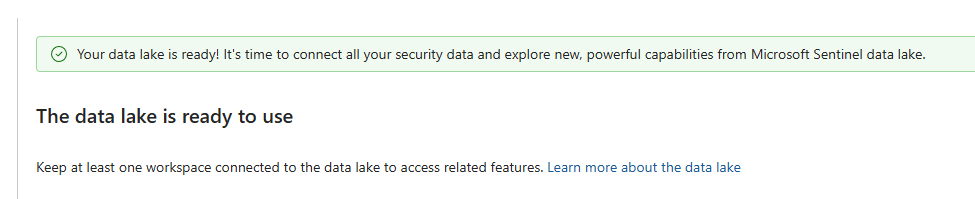
Everyone else gets the new model, and there's nothing to onboard. The Data lake page under Settings > Microsoft Sentinel, home of the old wizard, the capacity queue and the billing subscription, simply isn't there now. The lake comes with the workspace.
From there it's a table setting. Go to Microsoft Sentinel > Configuration > Tables, pick a table and open its retention settings. Keep it in analytics with a longer total retention and everything past the analytics window lives in the lake, for up to 12 years. Switch it to the data lake tier and it skips analytics altogether. If you already ran Sentinel without the lake, your old archive retention quietly becomes lake retention.
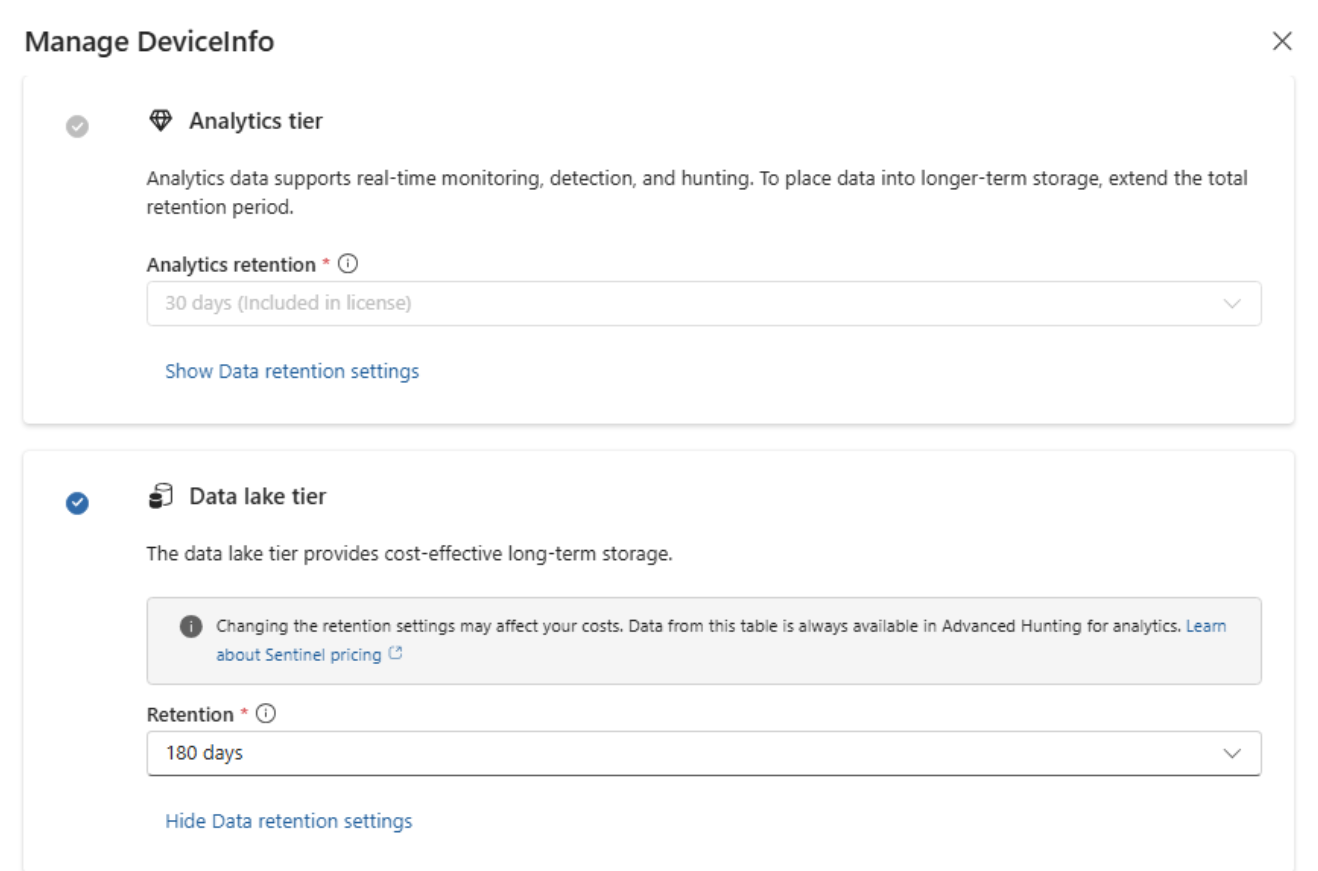
That missing page is also the quickest way to tell which model a tenant's on. A Data lake page under Settings > Microsoft Sentinel means the old model. No page means the new one.
| Tool | Old model | New model |
|---|---|---|
| Interactive KQL on lake data | Data lake exploration > KQL queries | Advanced Hunting |
| KQL jobs | Data lake exploration > Jobs | Summary rules, or a Fabric pipeline with a KQL activity |
| Notebooks | VS Code extension, Spark pools of 12, 32 or 80 vCores | Fabric notebooks |
| Custom graphs | Graphs, under Microsoft Sentinel | Fabric Graph |
| Search jobs | Available | Available |
What got pulled out of your build
The KQL queries page moving into Advanced Hunting is good news. Lake tables sit in the same editor as DeviceProcessEvents and the rest of your Defender data, you can join across them in one query, and I query a lake-only CommonSecurityLog there every day without any drama. That's how it should've worked from day one.
The Jobs page is the loss.
In my old guide, a KQL job took failed sign-ins, matched the attacker IPs against Cisco firewall logs in the lake, and wrote a small CiscoDailyLog_KQL_CL table into analytics. One wizard. One schedule. Five minutes.
The Fabric version of that job has four moving parts. You mirror SigninLogs and CommonSecurityLog into Fabric. You build a pipeline with a KQL activity and put it on a schedule. You create a custom table and a data collection rule so the output has somewhere to land, then send the results back through the Logs Ingestion API. Every step is documented and none of them is hard. There are just four of them now, spread across two products with two permission models.
Notebooks and custom graphs go the same way, onto Fabric capacity instead of the lake's own compute. If you pointed an agent at the Sentinel MCP server, its documentation still lists data lake onboarding as a prerequisite for most of the tools. I do wonder what it makes of a tenant that never onboarded to anything.
Microsoft's reasoning is fair enough. The old lake bundled storage with compute, compute was the scarce bit, and that's what the capacity queue was rationing. Split them and storage becomes a setting anyone can switch on, while compute goes to Fabric, where Microsoft already wants the rest of your organisation's analytics to live. It's a coherent plan. It also assumes your SOC has a Fabric team down the corridor.
On the old model it all still works, and there's no published end date. I'd still stop building new things on the old blade. Every new tenant lands on the new model, and I don't expect Microsoft to run two data lakes under one name forever.
Respeccing a lake job into a summary rule
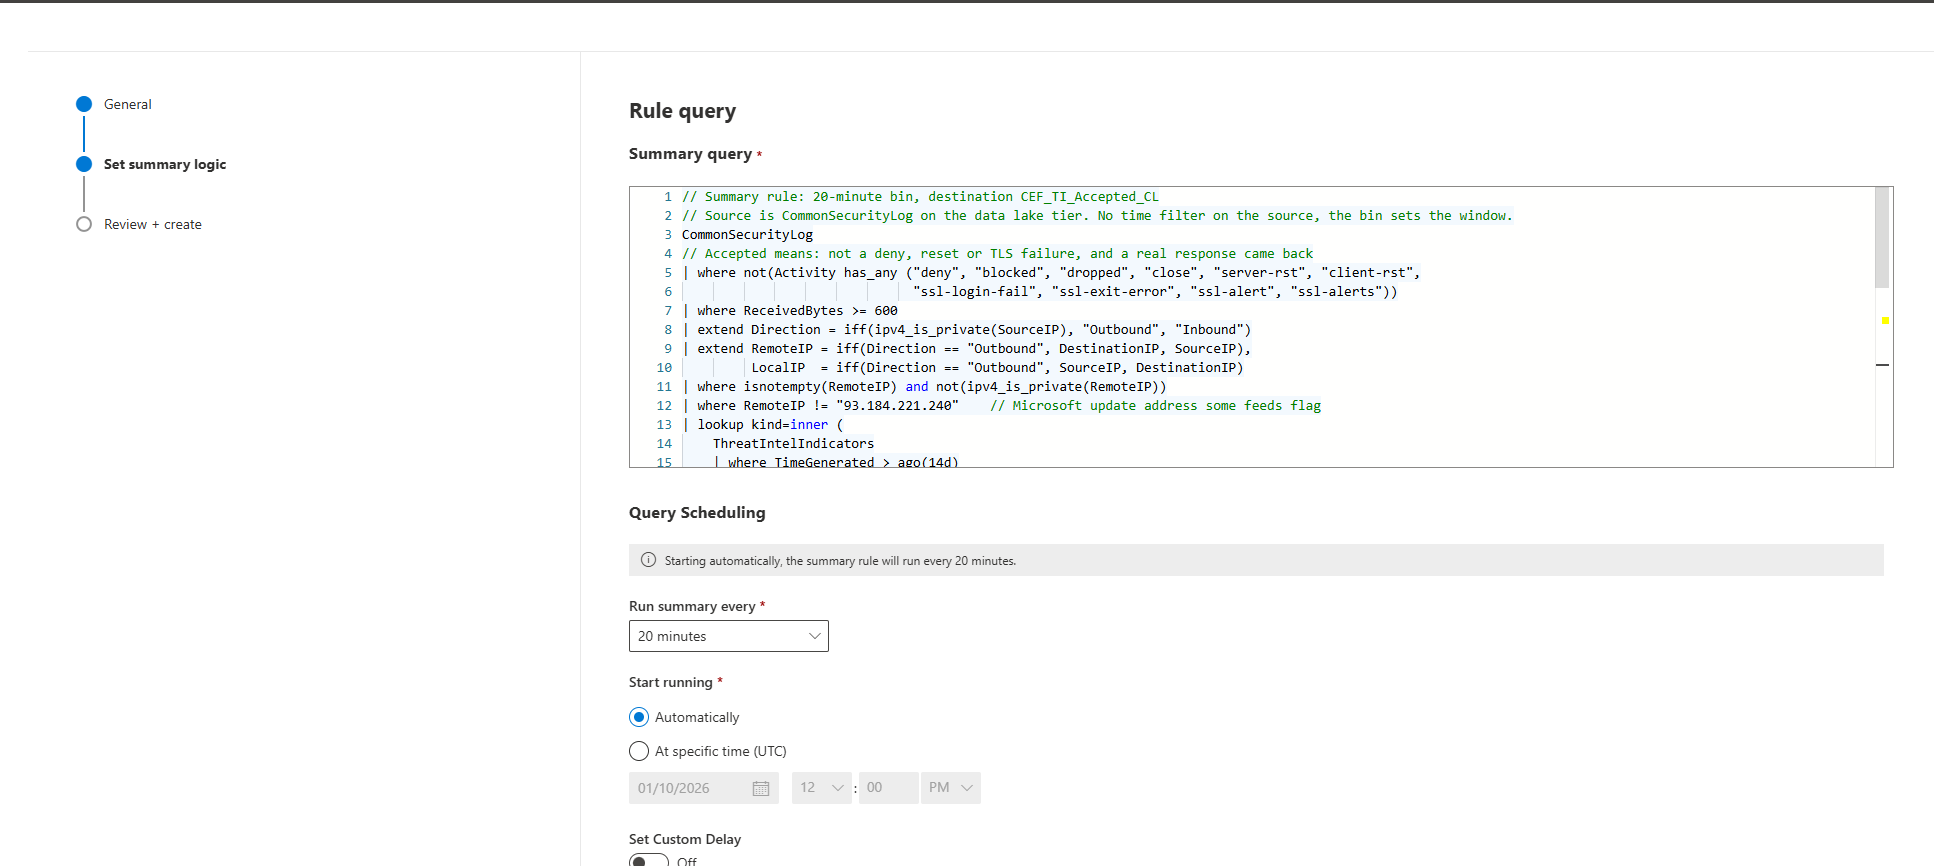
Summary rules can read data lake tier tables. With a lake-tier source you get full KQL on that one table plus lookup against up to five analytics tables, but no join to another lake table. Each run covers one bin of 20 minutes to 24 hours, gets 10 minutes to finish and can return up to 500,000 records. Results land in a custom _CL table in analytics. The read is billed per GB scanned and the output as analytics ingestion.
ThreatIntelIndicators is an analytics table, so the TI match fits inside the rule itself. The docs don't say whether a bin's time range also limits the table on the other side of a lookup, so I tested it. A 20-minute bin saw over 200,000 TI rows, far more than 20 minutes' worth, and the rule's been catching botnet traffic ever since. I still bound the TI side to 14 days, roughly one full republishing cycle.
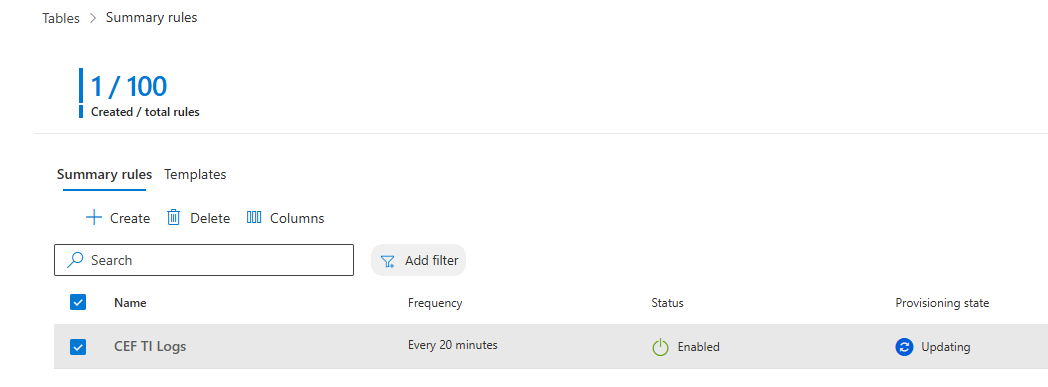
Step 1. The summary rule does the match. Source is CommonSecurityLog on the data lake tier, bin is 20 minutes, destination is a new table called CEF_TI_Accepted_CL.
// Summary rule: 20-minute bin, destination CEF_TI_Accepted_CL
// Source is CommonSecurityLog on the data lake tier. No time filter on the source, the bin sets the window.
CommonSecurityLog
// Accepted means: not a deny, reset or TLS failure, and a real response came back
| where not(Activity has_any ("deny", "blocked", "dropped", "close", "server-rst", "client-rst",
                              "ssl-login-fail", "ssl-exit-error", "ssl-alert", "ssl-alerts"))
| where ReceivedBytes >= 600
| extend Direction = iff(ipv4_is_private(SourceIP), "Outbound", "Inbound")
| extend RemoteIP = iff(Direction == "Outbound", DestinationIP, SourceIP),
         LocalIP  = iff(Direction == "Outbound", SourceIP, DestinationIP)
| where isnotempty(RemoteIP) and not(ipv4_is_private(RemoteIP))
| where RemoteIP != "93.184.221.240"    // Microsoft update address some feeds flag
| lookup kind=inner (
    ThreatIntelIndicators
    | where TimeGenerated > ago(14d)
    | where ObservableKey in ("ipv4-addr:value", "network-traffic:src_ref.value", "network-traffic:dst_ref.value")
    | summarize arg_max(TimeGenerated, *) by Id    // latest version of each indicator first
    | where IsActive == true and IsDeleted == false
    | where isnull(ValidUntil) or ValidUntil > now()
    | summarize TI_Confidence = max(Confidence), TI_Types = make_set(tostring(Data.indicator_types[0])), TI_Ids = make_set(Id, 5)
        by RemoteIP = tostring(ObservableValue)
  ) on RemoteIP
| summarize Connections = count(), FirstSeen = min(TimeGenerated), LastSeen = max(TimeGenerated),
            BytesReceived = sum(ReceivedBytes), LocalIPs = make_set(LocalIP, 10), Ports = make_set(DestinationPort, 10),
            TI_Confidence = max(TI_Confidence), TI_Types = take_any(TI_Types), TI_Ids = take_any(TI_Ids)
    by RemoteIP, Direction, DeviceVendor, DeviceProduct
Step 2. A boring analytics rule on the output. The table only ever holds accepted connections to or from known-bad IPs, so there's nothing left to decide. Run it hourly and map RemoteIP and LocalIPs as entities.
// Analytics rule: frequency 1 hour, query period 1 hour
CEF_TI_Accepted_CL
| where ingestion_time() > ago(1h)
That's the classic TI map rule for CommonSecurityLog, moved onto lake data. The raw firewall logs never touch analytics. You pay a lake scan per bin and analytics ingestion for a handful of rows.
Summary rules run out in four places: joining two lake tables on a schedule, needing every raw row rather than the hits, retro-hunting further back than a bin, and output that breaks 500,000 records or 10 minutes a bin. That's where Fabric earns its capacity bill.
The honest limitations
Lake tables still raise no alerts. Analytics rules don't read the lake. Every lake detection is now a summary rule like the one above, Fabric pipeline or an auditing tool that can help with investigation/hunting.
Every lake query runs a meter. Queries against lake data bill per GB scanned, about £0.0047 at UK South list prices. A year-long hunt across a 100 GB a day firewall table scans 36.5 TB and costs about £171, every time someone presses Run. Finance will want a word. Queries against the analytics tier carry no per-query charge, so your hunters need a new habit: time range first, Run second.
Filter rule works with Data Lake, Split rule does not. If you are planning to use split rule do it before moving your tables to Data Lake
Fabric is a second platform, not a menu item. An F2 is about £226 a month on UK South pay-as-you-go if you leave it running, and that's before permissions, skills, and deciding who gets paged when a pipeline fails at 2am and a detection quietly stops getting data. Mirroring from Azure Monitor into Fabric is still in preview, too.
Two lakes, one product name. For an MSSP, the onboarding date splits the customer base into two operating models. Every runbook has to say which one it's for, and every new analyst learns both.
The real decision
These are UK South list prices on a 30-day month, for a lake-only firewall table kept for 12 months.
| Cost | 10 GB a day | 100 GB a day |
|---|---|---|
| Lake ingestion and processing | about £42 a month | about £422 a month |
| Lake storage at the 12-month mark | about £11 a month | about £110 a month |
| One query across the full year | about £17 | about £171 |
| Same data into analytics, pay-as-you-go ingestion | about £1,284 a month | about £12,840 a month |
| Fabric F2, left running | about £226 a month | about £226 a month to start |
The storage maths is still excellent: about £531 a month in the lake at 100 GB a day, against £12,840 in analytics. The surprise is at the small end. At 10 GB a day the lake costs about £53 a month, and an always-on F2 costs more than four times that before anyone's written a line of Spark.
You never had the lake. Use it. Moving a table takes two minutes in Table management, once you've checked that no analytics rule reads it. Hunt in Advanced Hunting, detect with summary rules, and don't buy Fabric until a specific job needs it.
You've got the old lake and use it as a shelf. Nothing to do.
You built on jobs, notebooks, graphs or the MCP server. Nothing breaks today. Freeze new builds on the old blade and work through the steps below.
MSSPs. Record which customer's on which model, build shared content on summary rules and search jobs, and don't redesign a service before Ignite (17 to 20 November).
Next steps
- Sort your tenants by model (2 minutes each). A Data lake page under Settings > Microsoft Sentinel means the old model. No page means the new one.
- Export your job list (30 minutes). Go to Microsoft Sentinel > Data lake exploration > Jobs and record each job, the table it writes to, and which analytics rules read that table.
- Rebuild each job (1 to 2 hours each). Filter and match on one table becomes a summary rule plus an analytics rule. One-off digging becomes a search job. Scheduled joins across lake tables become a Fabric pipeline.
- Pilot Fabric on one table (half a day), but only if step 4 left you a job that needs it. Mirror one table into a Fabric workspace on an F2, run one scheduled KQL activity, check the capacity metrics, then pause the capacity.
- Revisit after Ignite (1 hour). Re-read Microsoft's What's new page the week after 20 November. I expect at least one row of that first table to change.
Class dismissed.