Azure Diagnostic Settings: The Azure Policy Rabbit Hole Nobody Told You About

All right class.
If you run Microsoft Sentinel and you are not using Azure Policy to enforce diagnostic settings across your subscriptions, you are doing something wrong.
Diagnostic settings are how Azure resources actually send their logs somewhere useful. Without them, your Key Vault, Network Security Groups, Public IP addresses, and everything else is generating telemetry that disappears into the void. It never reaches Sentinel. It never reaches your Log Analytics workspace. It does not exist for detection purposes.
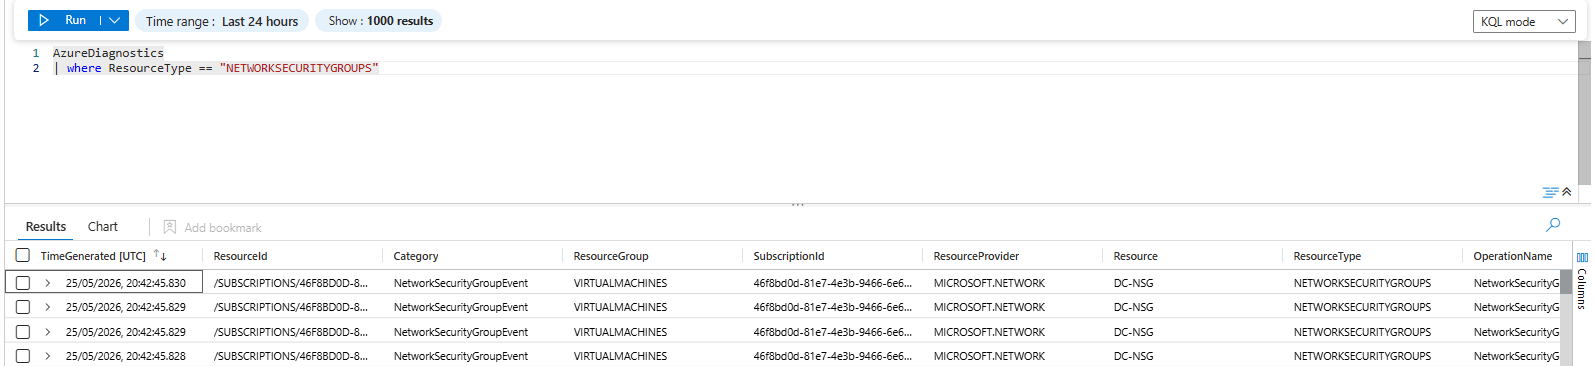
The manual approach to fixing this is a nightmare. Someone deploys a new service, forgets to configure diagnostic settings, and now you have a blind spot you will not discover until you are mid-incident asking "why do we have no logs for this resource?"
It will be easier when using my workbook, but that's more for your special ad-hoc requirements or testing.
 Bartosz Wysocki
Azure Policy solves this by enforcing it automatically. You assign a policy at subscription or management group scope, point it at your Log Analytics workspace, and every resource in scope gets diagnostic settings deployed whether the person who created it remembered or not. New resources get covered on creation. Existing ones get fixed through a remediation task. The gap closes itself.
You Have Hundreds of These Policies and You Have Deployed Almost None of Them
Open the Azure portal, navigate to Policy > Definitions, and filter by category Monitoring. Then type "Log Analytics" in the search box.
What you get back is pages and pages of built in policies covering every service class Microsoft ships. Service Bus, Event Hubs, Cosmos DB, Synapse, Databricks, Recovery Services vaults, public IP addresses, and many many more
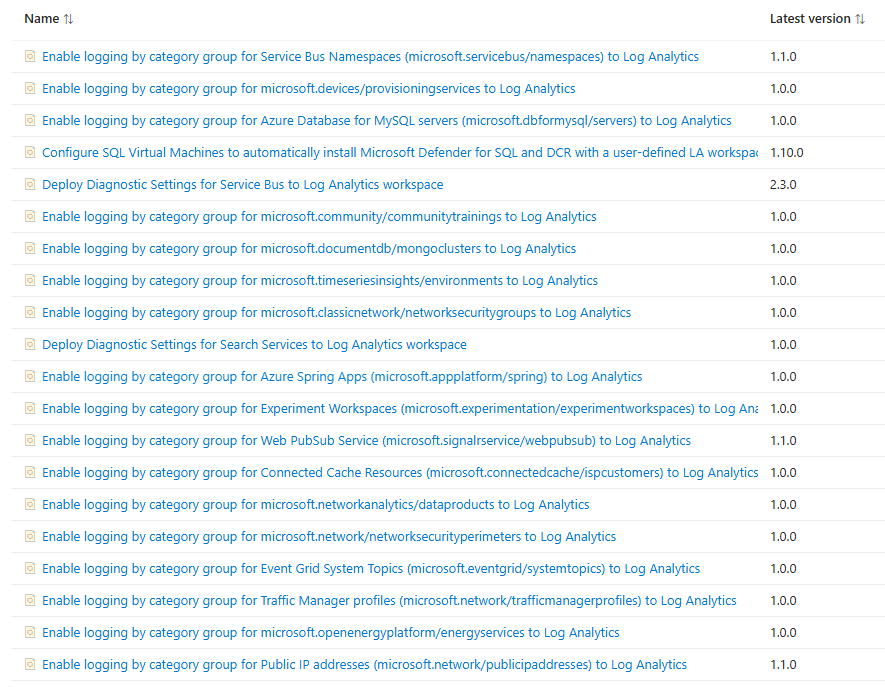
Every single one of them follows the same pattern. DeployIfNotExists effect, a logAnalytics parameter pointing at your workspace, a deploymentScope at subscription or management group, and a remediation task that fixes any resource that does not already have diagnostic settings configured.
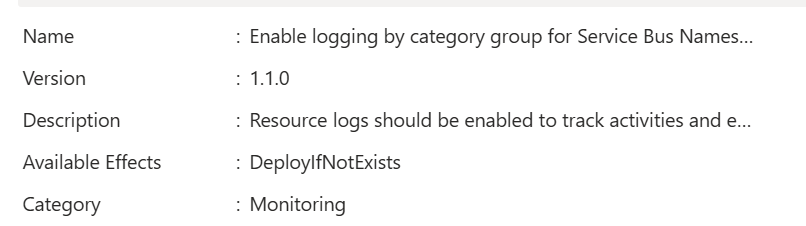
The policies already exist. Microsoft wrote them. They are free to assign. The problem is that nobody is actually going through this list and assigning the relevant ones for their environment.
Why This Actually Matters for Your SOC
If a resource is not sending logs to your workspace, it does not exist from a detection perspective.
Take a Network Security Group sitting in front of your domain controllers. Without diagnostic settings, you have no NetworkSecurityGroupEvent, no NetworkSecurityGroupFlowEvent. Your DC subnet is making allow and deny decisions all day long and none of it reaches Sentinel. Lateral movement from a compromised workstation hitting your DC on port 445, a rogue device probing RDP, an attacker enumerating LDAP from an internal IP that should never touch that subnet. All of it invisible.
With the policy assigned and diagnostic settings in place, you start seeing every rule evaluation. Which rule fired, in which direction, from which source address, against which destination. You can build a KQL query that alerts the moment something outside your known management subnets successfully hits your DC NSG on a sensitive port. That detection does not exist without the logs.
Key Vault tells a similar story. A compromised service principal quietly bulk-reading secrets is one of the most common early stages of a serious cloud incident. The operation lands as SecretGet with a ResultType of Success, the CallerIPAddress looks internal or cloud-adjacent, and nothing fires because there is no anomaly in isolation. But if you have AuditEvent logs flowing and you build a baseline of which identities normally touch which vaults, a new identity_claim_oid_g hitting your production Key Vault at 3am stands out immediately.
I have added multiple examples on what you could do with those logs here
Bartosz Wysocki
Without diagnostic settings you get none of that. The secret was read. The operation succeeded. Azure knows. You do not.
The logs exist. Azure generates them regardless. You just never plumbed them in.
The Two Policy Shapes You Will See
When you go through that Monitoring category list, you will notice two distinct policy naming conventions and they are not identical in behaviour.
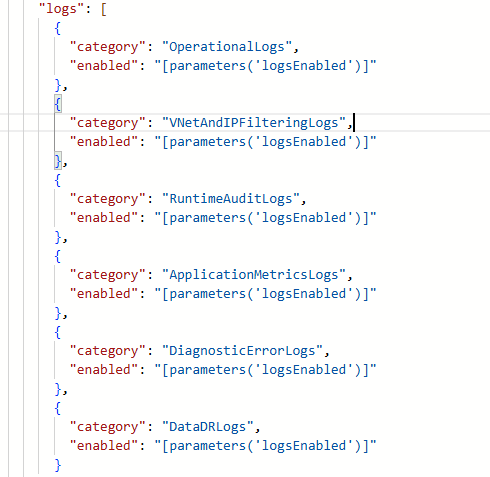
"Deploy Diagnostic Settings for X to Log Analytics workspace" is the older pattern. These are typically version 1.x or 2.x, use more explicit category names in the policy logic, and configure specific log categories like OperationalLogs, VNetAndIPFilteringLogs, RuntimeAuditLogs. They target individual services with hardcoded category lists. The trade off is that when Microsoft adds a new log category to a service, these older policies do not pick it up automatically.
"Enable logging by category group for X to Log Analytics" is the newer pattern, typically version 1.0.0 or 1.1.0, using the categoryGroup approach. Instead of listing specific categories, they configure the allLogs or audit category group, which means when the service adds a new log category in the future, your diagnostic setting picks it up without requiring a policy update or reassignment.

If both types exist for the same service, assign the category group version. It is the direction Microsoft is going and it requires less maintenance.
This Is Where You Can Get It Wrong
Do not go into the Azure Policy, find one or two policies, assign them to a single resource group they care about today, and call it done.
Three months later there is an incident involving a resource type they never thought to enable logging for. A Logic App integration account. An Event Grid topic. A container group. Something completely unremarkable until it was not.
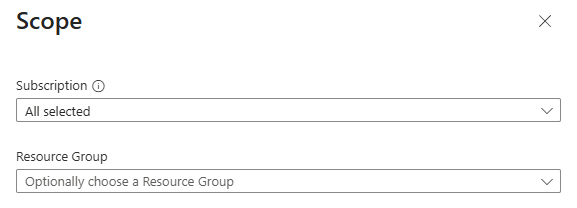
The correct approach is to work at subscription scope or ideally management group scope, so that any new resource deployed into your environment inherits the policy assignment immediately. No manual steps. No "remember to turn on logging when you deploy that new service". The policy remediates it automatically.
What You Should Actually Do Right Now
Do not go through that list and assign every policy you can find. That is the wrong move and you will end up drowning in logs that mean nothing, paying for ingestion you cannot justify, and building zero detections out of any of it.
Start with one resource type. Pick something that actually matters in your environment and where you genuinely believe there is detection value. NSG logs are usually the best first choice because network layer visibility is something most Sentinel deployments are missing entirely and the data is immediately actionable. Public IP address logs are another solid early pick. Azure AD Domain Services if you run it. SQL Server auditing if you have databases handling anything sensitive.
Assign the policy, create the remediation task, wait 24 hours, and then actually look at what lands in your workspace. Query it. Read the fields. Ask yourself whether you can build something useful out of this data or whether it is just noise. If you can see a detection, build it. If the logs are meaningless for your environment, pull the policy back.
Then do the next one.
The worst thing you can do is treat this like a compliance checkbox exercise where more policies assigned equals more secure. Some of these resource types generate enormous volumes of low value telemetry that will cost you real money and teach you nothing. Recovery Services vault logs, for example, are not exactly a goldmine for threat detection. Bot Services, Community Trainings, Time Series Insights, these are not where your investigation time should go.
The ones worth serious consideration for most environments are NSGs, public IPs, Azure AD Domain Services, SQL Server auditing, Key Vault, and Azure Activity logs which you should honestly have had sorted from day one. Everything else is a judgment call based on what you actually run and what your threat model looks like.
The Logs Actually Worth Your Time
Key Vault
AuditEvent→ AzureDiagnostics (it will land in that table)
Secret reads, key operations, access policy changes. Essential for catching compromised service principals.
Network Security GroupsNetworkSecurityGroupEvent · NetworkSecurityGroupRuleCounter → AzureDiagnostics
Rule-level allow and deny decisions at the network layer.
NSG Flow Logs
Flow Logs v2 via Network Watcher + Traffic Analytics → AzureNetworkAnalytics_CL
Actual traffic flows with source IPs, destination IPs, ports, and bytes. Not the same as NSG diagnostic logs. Set both up.
Azure FirewallAzureFirewallApplicationRule · AzureFirewallNetworkRule
Use resource-specific tables (AZFWApplicationRule, AZFWNetworkRule etc.), not legacy AzureDiagnostics.
Azure WAFApplicationGatewayAccessLog · ApplicationGatewayFirewallLog → AzureDiagnostics
WAF rule matches and blocked requests against public-facing apps.
Azure SQL / Managed Instance
SQL Auditing → SQLSecurityAuditEvents
Who ran what, from where, as which identity. Non-negotiable for sensitive databases.
Storage AccountsStorageRead · StorageWrite · StorageDelete per sub-service → StorageBlobLogs · StorageFileLogs · StorageQueueLogs · StorageTableLogs
Enable selectively on sensitive accounts only. Not globally. The volume will hurt you.
Microsoft Entra Domain Services
AccountLogon · AccountManagement · LogonLogoff · DirectoryServiceAccess · PolicyChange · PrivilegeUse · DNSServerAuditDynamicUpdates · DNSServerAuditGeneral → AADDomainService[...]
Kerberos abuse, LDAP enumeration, suspicious logons, GPO changes, and DNS manipulation all land here. The DNS categories are the ones everyone forgets and they are exactly where you catch someone messing with internal name resolution.
Remediation Tasks Are Not Optional
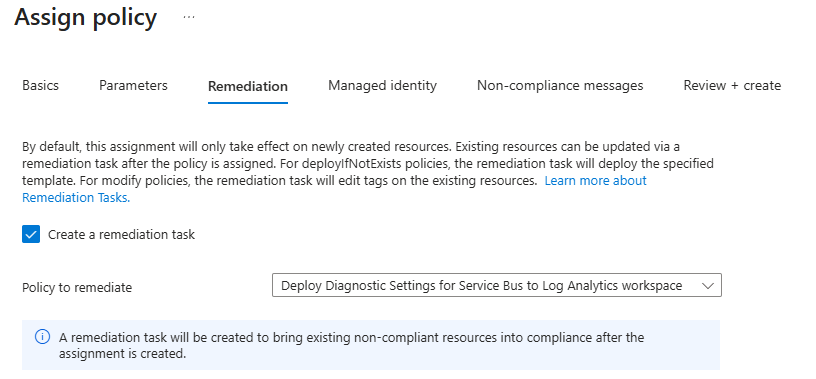
When you assign a policy with DeployIfNotExists effect, new resources get covered automatically going forward. Existing resources do not. You have to create a remediation task to evaluate and fix the current state.
Go to Policy > Remediation, find your newly assigned policy definitions, and create a remediation task for each one. Azure will scan the resources in scope and deploy the diagnostic settings on anything that is non-compliant.
Do not skip this. The whole point of doing this work is to have consistent logging across your estate now, not just for whatever gets deployed next month.
Your Next Steps This Week
In order. Do not skip around.
- Pick one resource type that genuinely matters in your environment. NSG logs are usually the best first choice. Entra Domain Services if you run it. Key Vault if you have services handling sensitive secrets. SQL Server if you have databases handling anything sensitive. Azure Firewall or WAF if you have them. Storage Accounts on sensitive accounts only - not globally.
- Go to Policy > Definitions, filter category to Monitoring, search "Log Analytics", and find the policy for that one resource type. Take the category group version if both exist.
- Assign it at subscription scope. Set your Sentinel Log Analytics workspace as the logAnalytics parameter.
- Create a remediation task during the assignment. Do not skip this - existing resources are not covered until you do.
- Wait a few hours, then actually query what landed. Read the fields. Ask yourself whether there is a detection in this data or whether it is noise for your environment (I will cover more of the diagnostic hunting & analytic rules in future blogs)
- If you can see something worth detecting, build it. If not, pull the policy back.
- Then pick the next one.