Three Essential Sentinel Workbooks You Should Deploy Right Now
All right class.
Workbooks That Actually Solve Problems
Microsoft has already built three workbooks in Content Hub that handle the problems you're dealing with right now. Install them. Use them.
Each one solves a specific pain point every SOC has. None requires configuration beyond clicking Install. Each becomes immediately useful in your daily workflow.
Workspace Usage Report: Know What You're Actually Paying For
Your workspace is ingesting logs 24/7, but do you know which tables are eating your budget? Most teams have no idea how to check it on a daily basis. They see the Azure bill spike, panic, then start querying logs and looking for baselines and spikes.
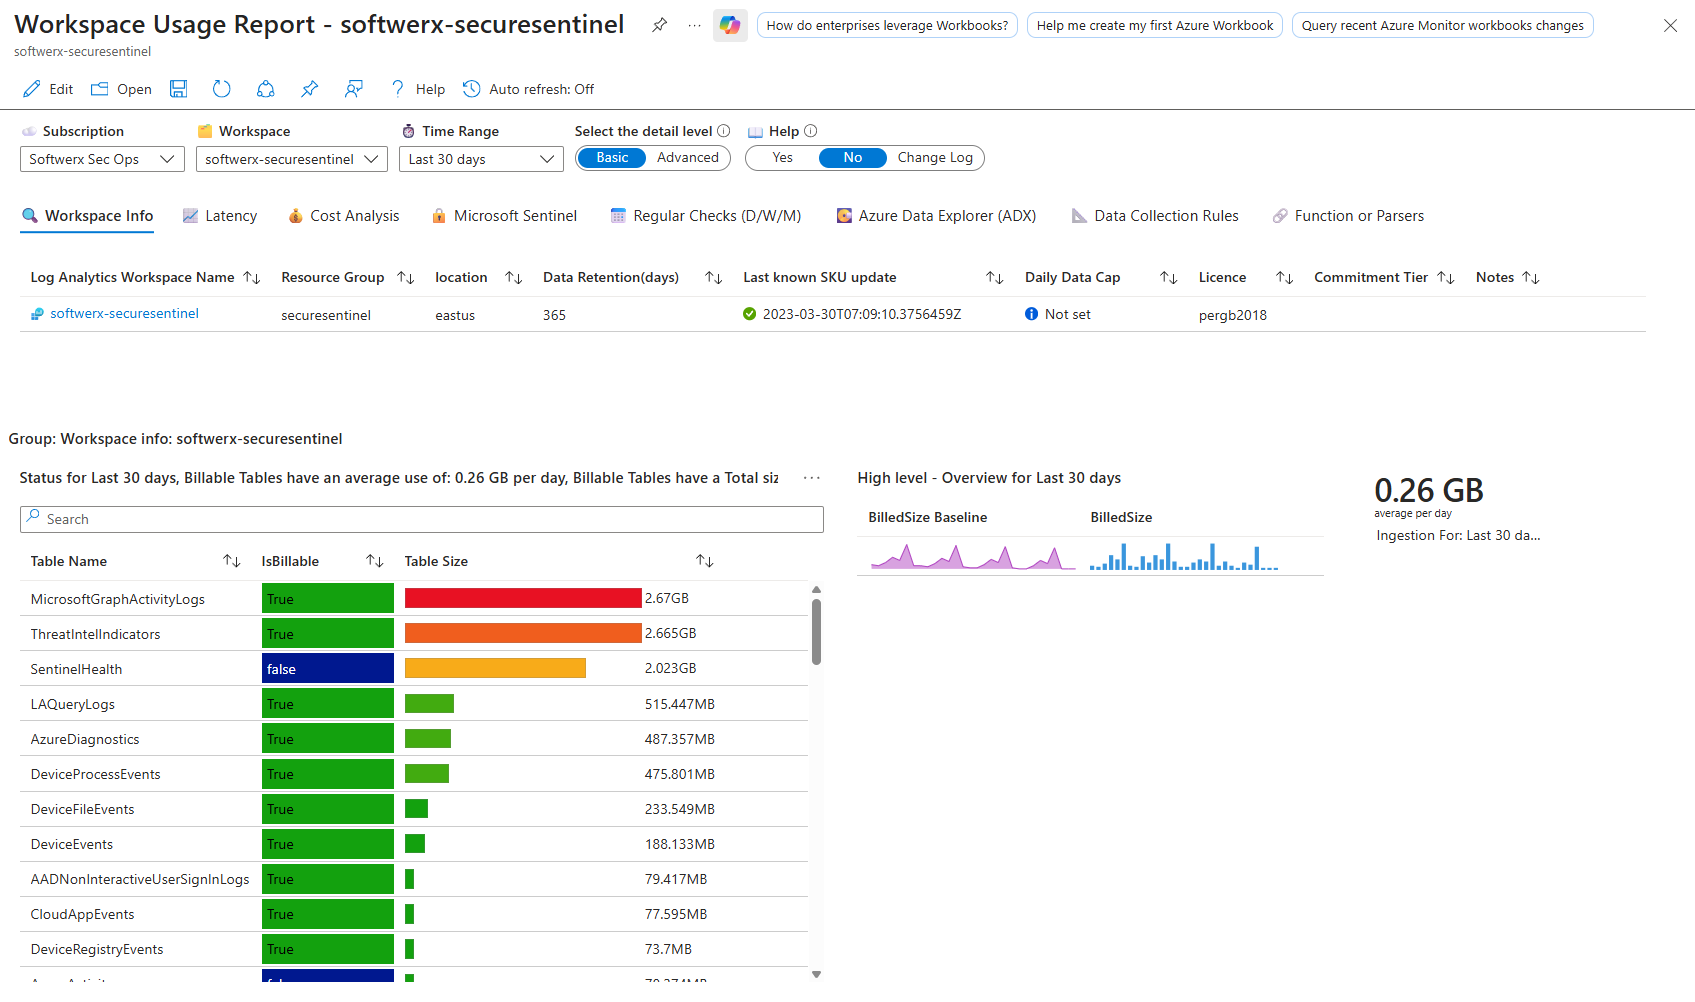
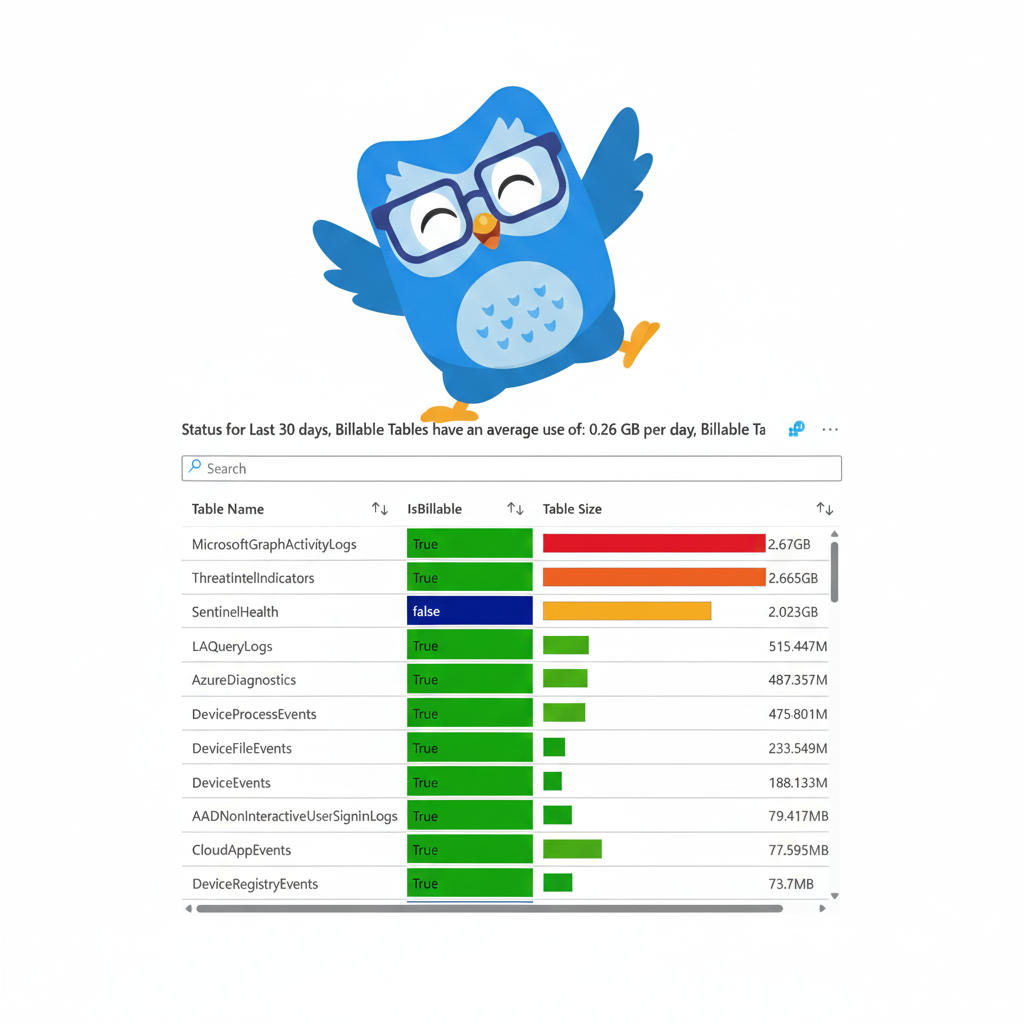
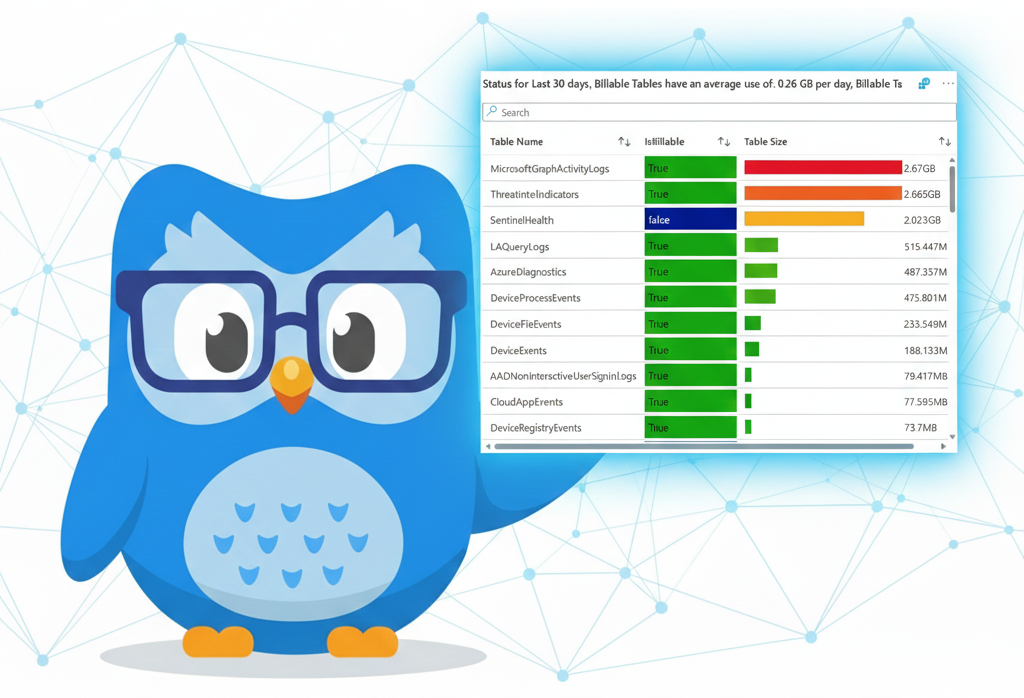
Workspace Usage Report stops this nonsense. Open it, and you see immediately how many GB each table consumed, cost breakdowns by table, ingestion trends over days and weeks, and cost projections for the month ahead. You can spot when a single table jumps from 0.5 GB to 5 GB daily and investigate why before your bill doubles.
The workbook tabs are built for different audiences. Workspace Info shows metadata of your tables, spikes, usage, and sizes.
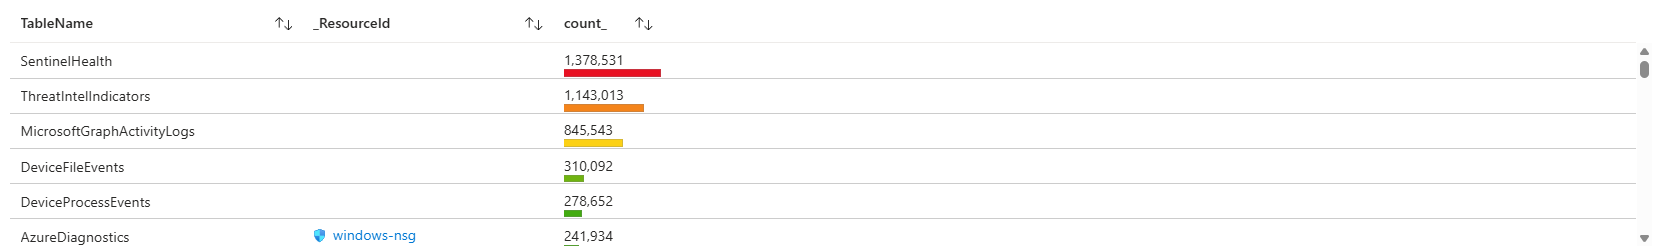
Cost Analysis breaks down estimated monthly spend and what's driving it. The biggest tables are highlighted so you know instantly which ones to tune or drop.
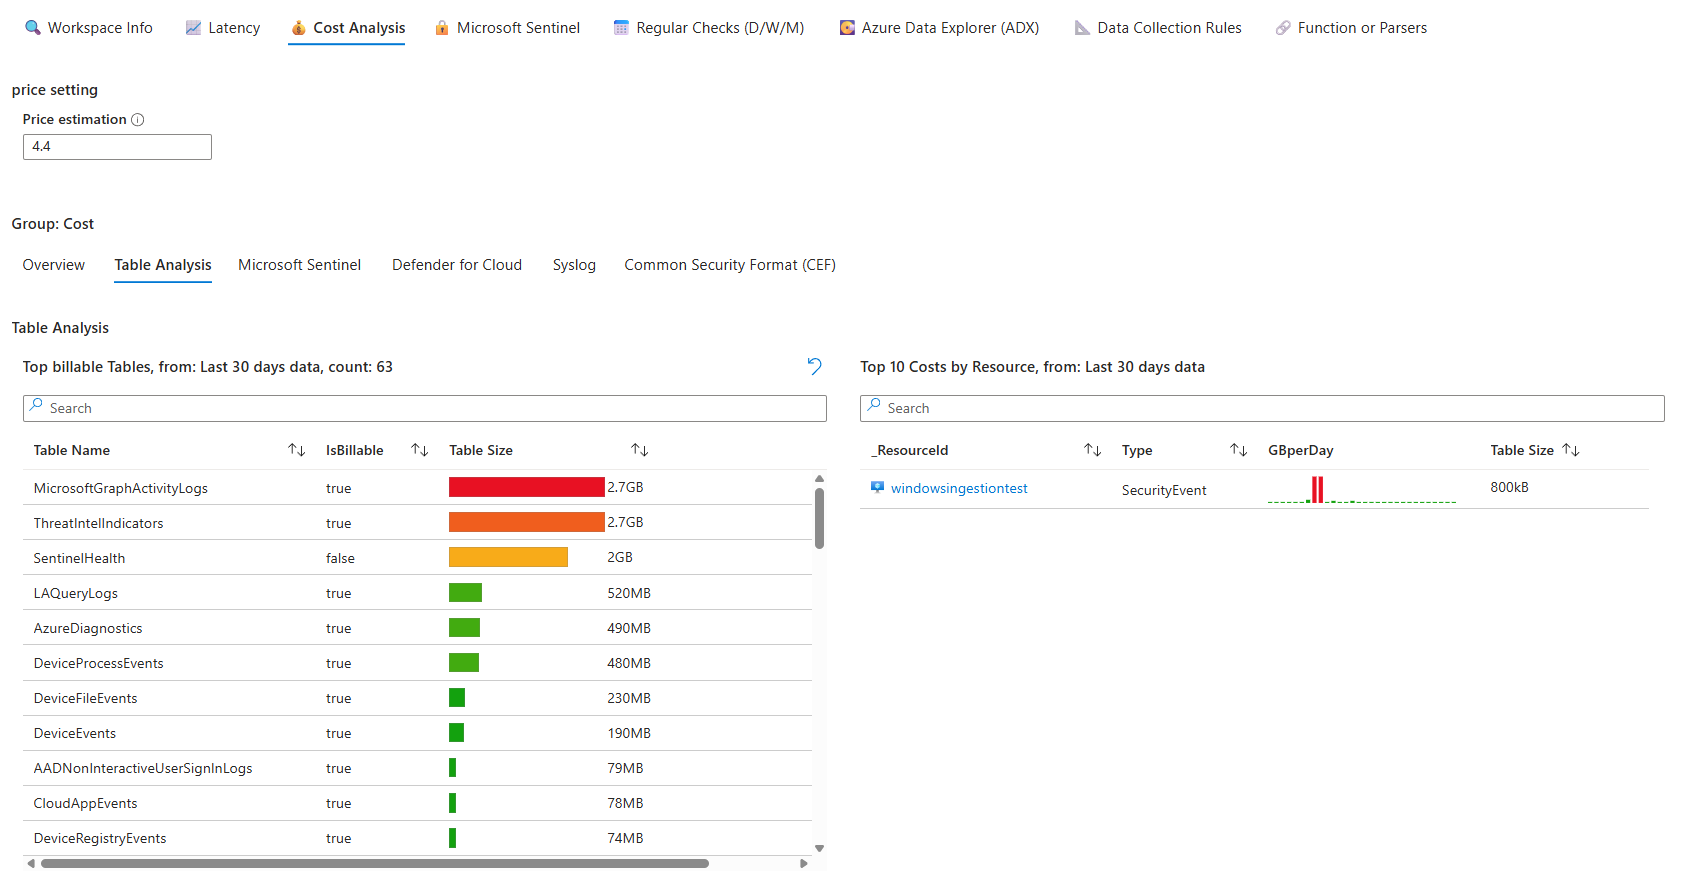
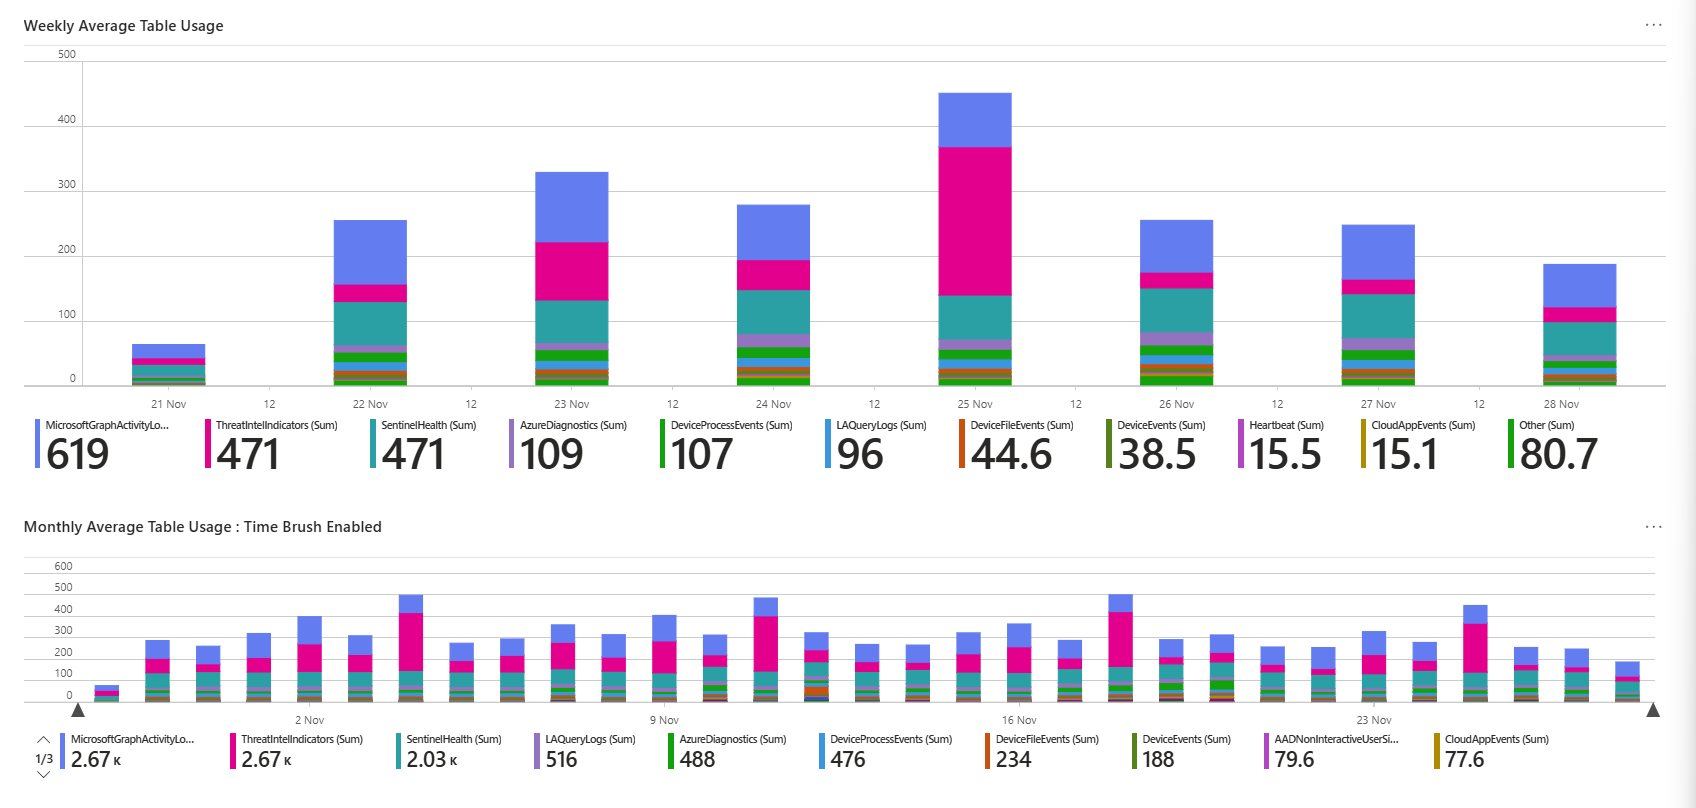
Most critical part: the anomaly detection. Billable table ingestion with sparklines shows which tables have spikes or dips. If SecurityEvent suddenly went from steady 3 GB per day to spiking at 8 GB, that tab flags it instantly. You can then drill down into the table, check for a misconfigured collector, or validate the spike is legitimate before costs spiral.
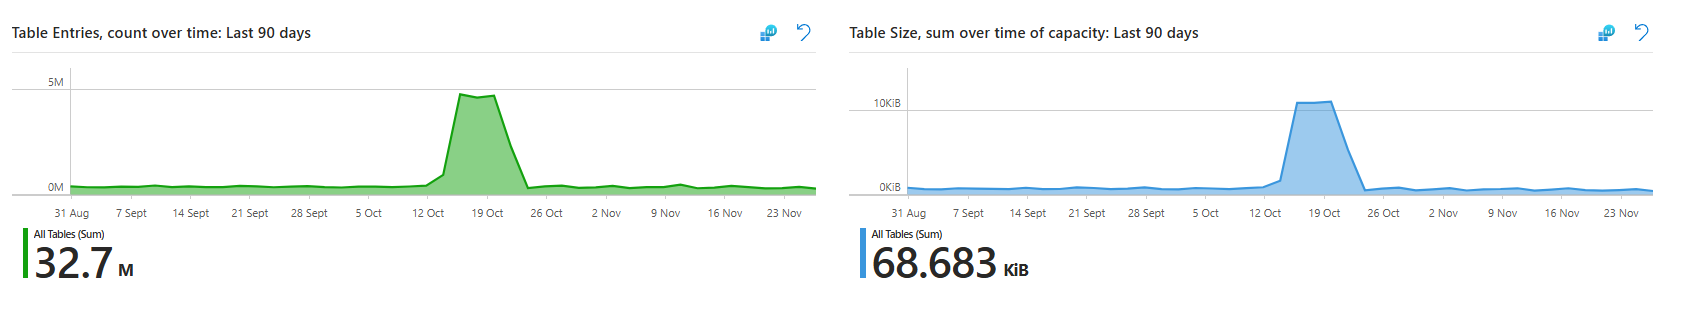
Common mistake: ignoring this workbook until the bill shows up. Check it weekly. Five minutes reviewing trends saves thousands in surprise costs. Tables that grow 50% month over month deserve investigation.
You can deploy it from Content Hub, open it with your subscription and workspace selected, then bookmark it. Run it monthly to stay on top of ingestion patterns before they become cost disasters.
Sentinel Workspace Recon Tools: Your Table Explorer When Things Break
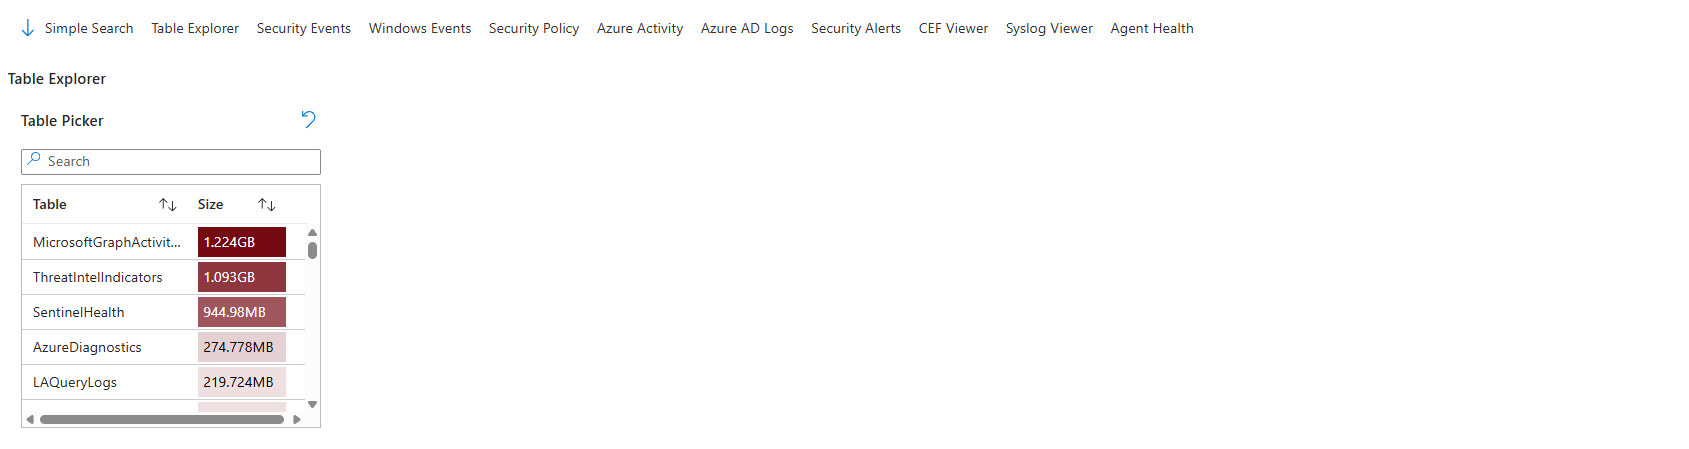
When an incident happens, and you need to drill down fast, this workbook is your window into what actually happened. No waiting for analysts to copy-paste KQL queries. The Table Explorer tab gives you a pick list of tables, columns, and counts without writing anything.
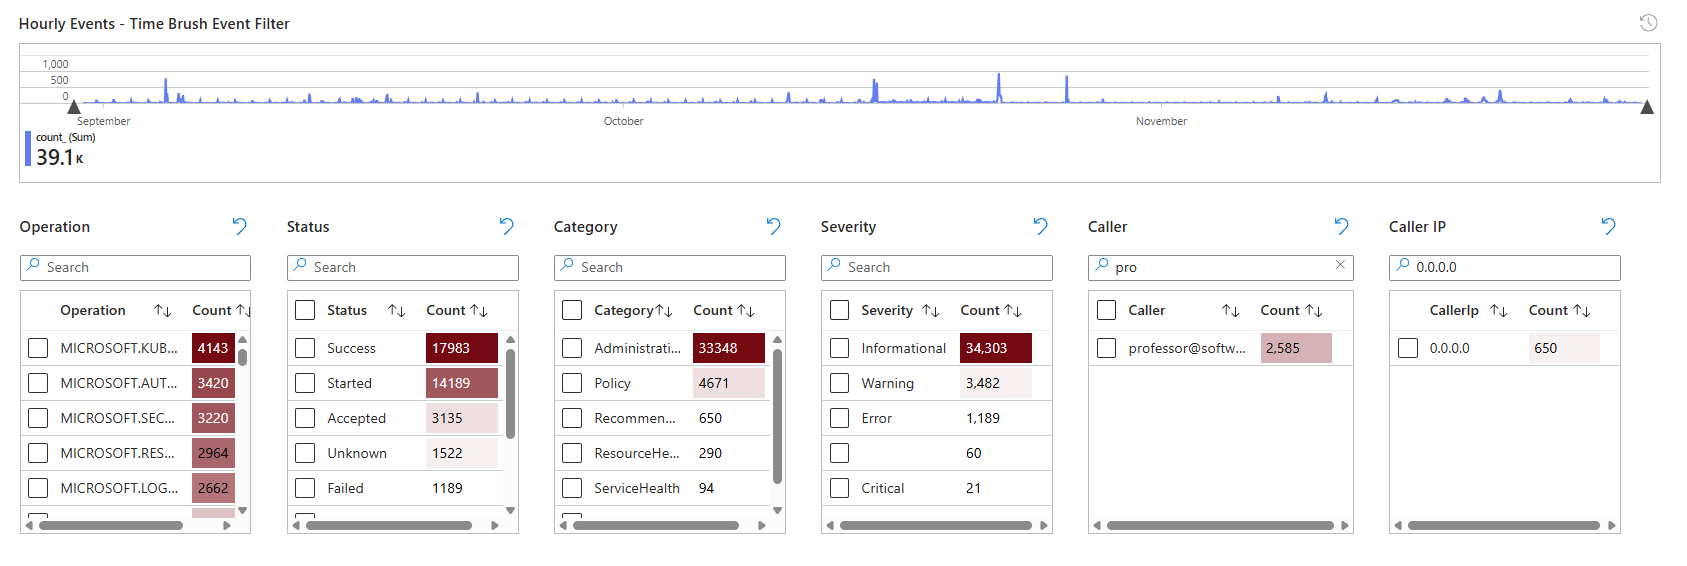
Open it, and you see a time graph at the top showing event frequency. Click on a spike and instantly see which events or operations were happening at that moment. Below it are filters for Source, Identity, Result, Severity, Caller, and many more (depending on the table, of course). Filter by anything, and the results show you only matching records from that table.
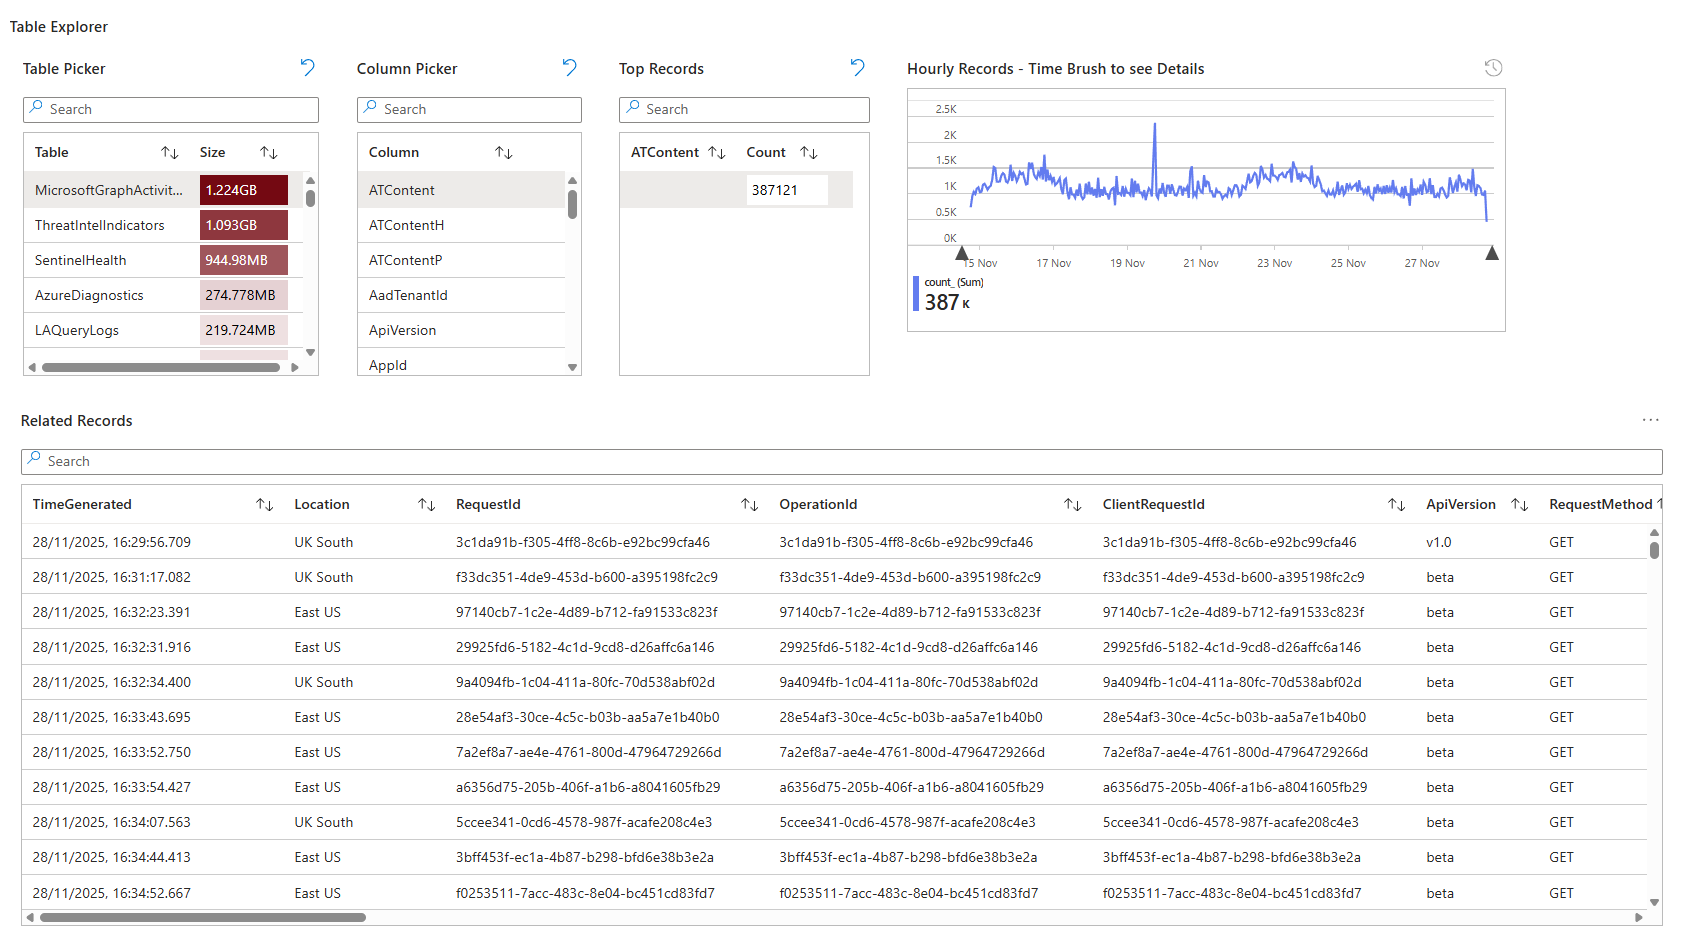
Click the Table Picker dropdown and choose any table in your workspace (AzureDiagnostics, AuditLogs, SecurityEvents, WindowsEvents, etc.). The workbook switches context entirely, showing you that table's schema and data. No waiting for Log Analytics to load. No manual query writing.
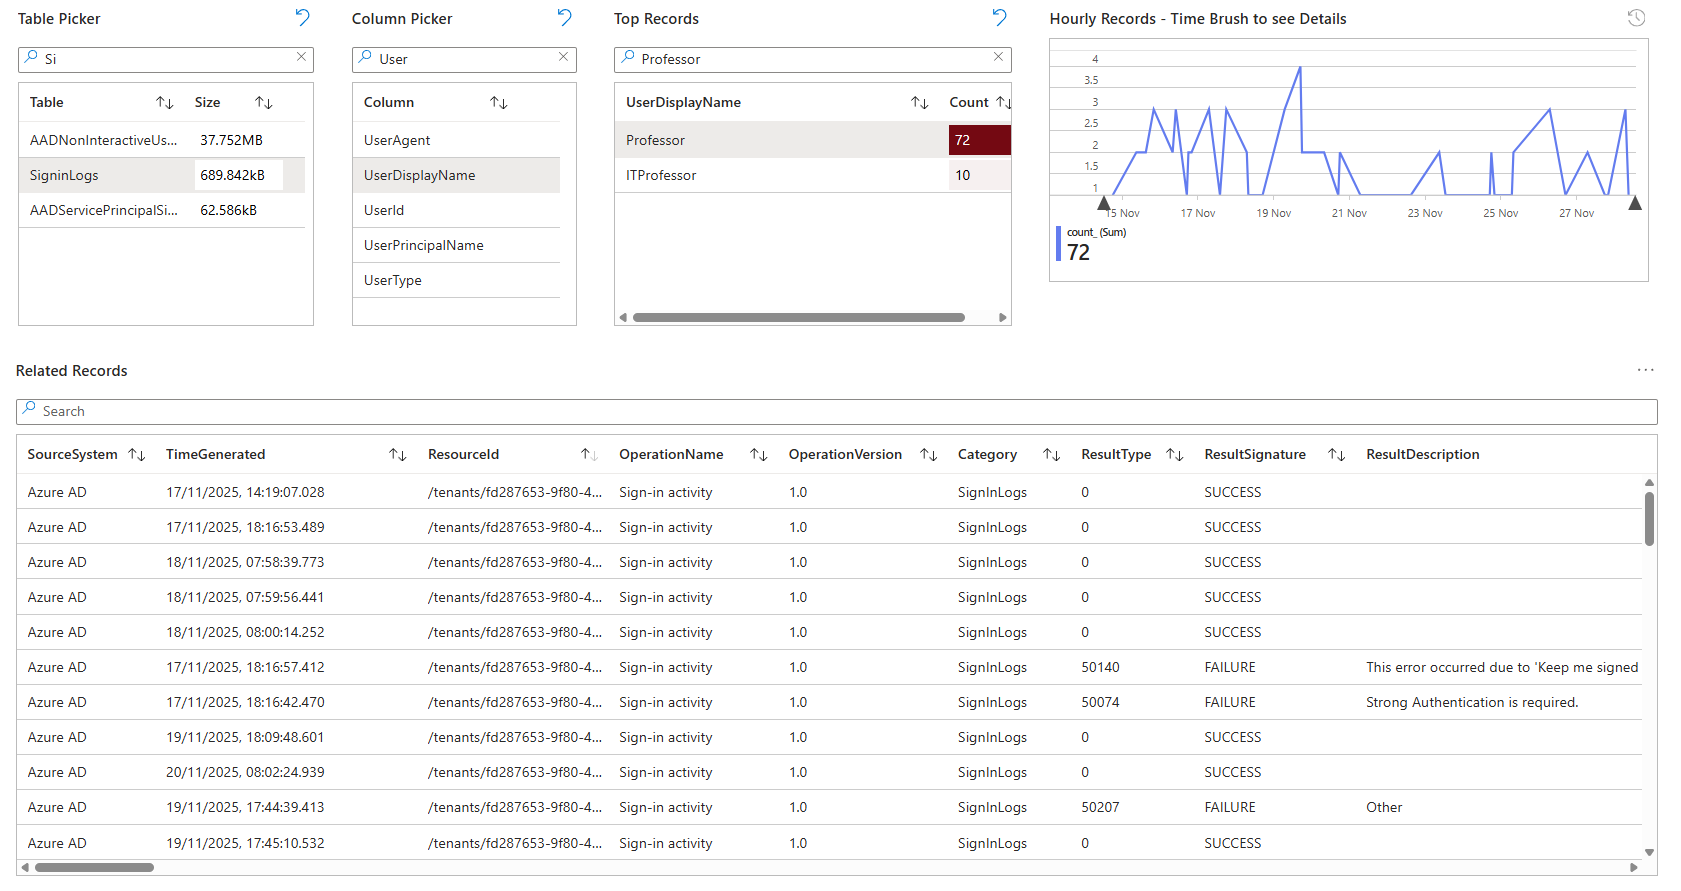
This is where it breaks down the investigation time from minutes to seconds. Your team spots a spike in failed sign-in attempts. Click SigninLogs, pick UserDisplayName and the actual user name, and you instantly see the accounts and IPs involved. One click drills to raw record details.
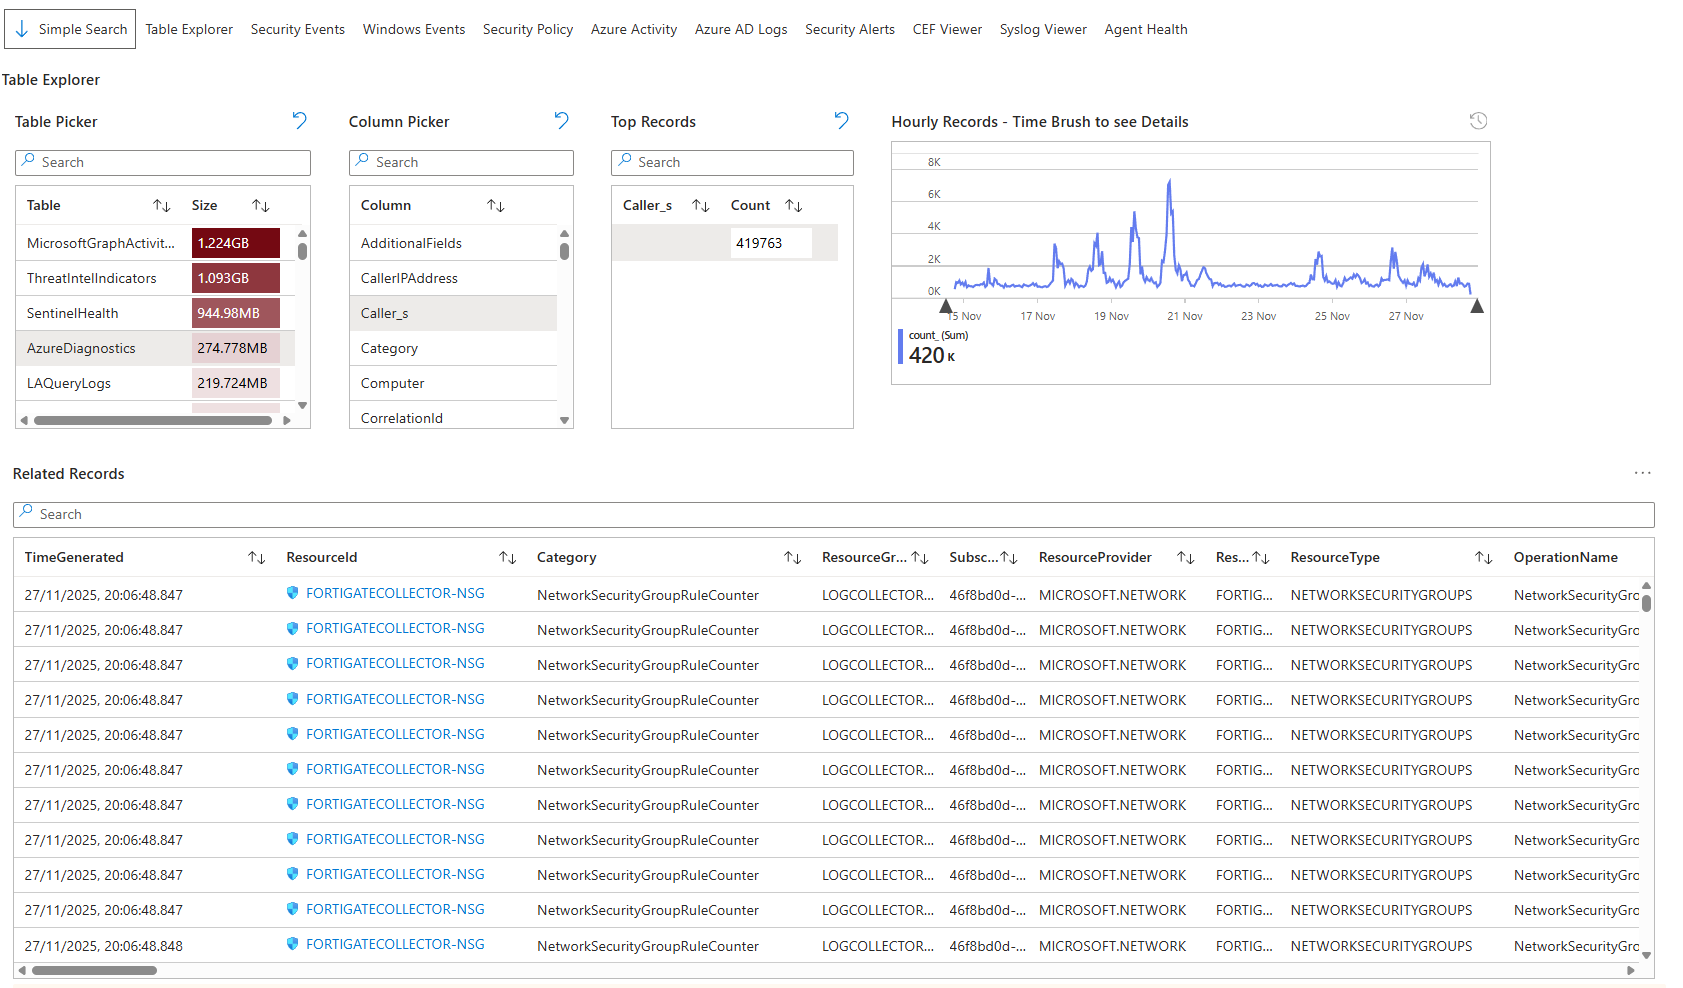
Real-world scenario: Friday afternoon, an incident ticket arrives about a suspicious Azure Activity. Open the workbook, switch to AzureActivity table, filter by time range and suspicious operation type, and you have answers before you finish reading the ticket. No "let me run a query real quick" moment. Data is live and filterable immediately.
The workbook has tabs for Simple Search, Table Explorer, Security Events, Windows Events, Security Policy, Azure Activity, and Agent Health. Each is pre-configured for that data source. It's not fancy, but it's fast. That matters when you're investigating.

Install it, use it immediately on an incident, then keep it in your bookmarks. This is the table viewer SOC teams didn't know they needed.
Security Operations Efficiency: How Good Is Your SOC Actually
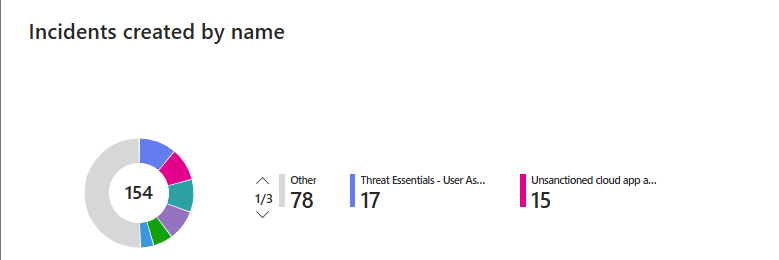
Management asks: How many incidents did the team close? How long do they take? Who's faster? What severity are most incidents? Which MITRE tactics are firing most?
Security Operations Efficiency answers all of it visually. No reading spreadsheets. No reporting queries. Open it, and you see incident counts by status, incidents by severity over time, mean time to triage (MTTR), mean time to resolve (MTTR), and incidents by tactics.
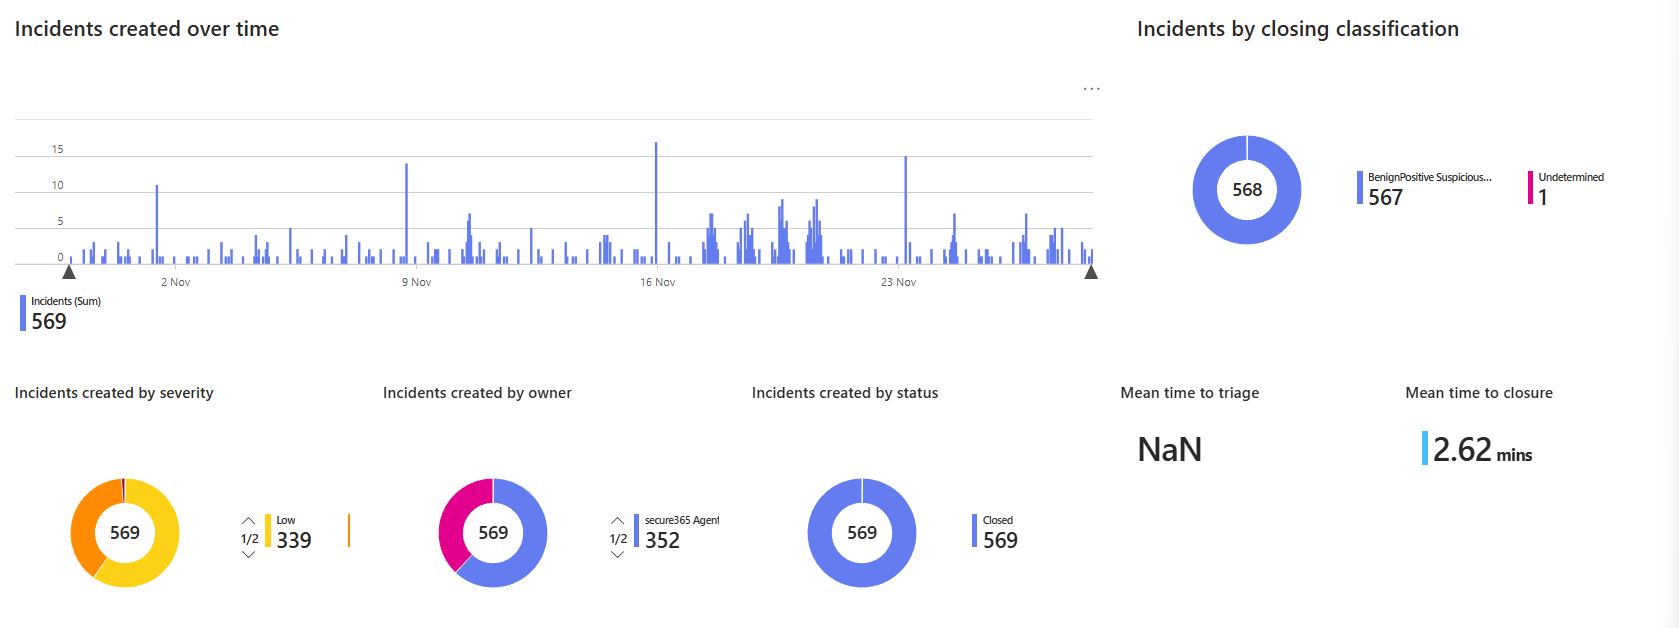
The dashboard is built for SOC managers. You can slice by severity, tactics, owner, and product name to spot patterns. If your team takes 3 days to close high-severity incidents and 12 hours for low-severity severity, the dashboard shows that instantly. If Microsoft Defender is generating more incidents than Azure Sentinel, you see it.
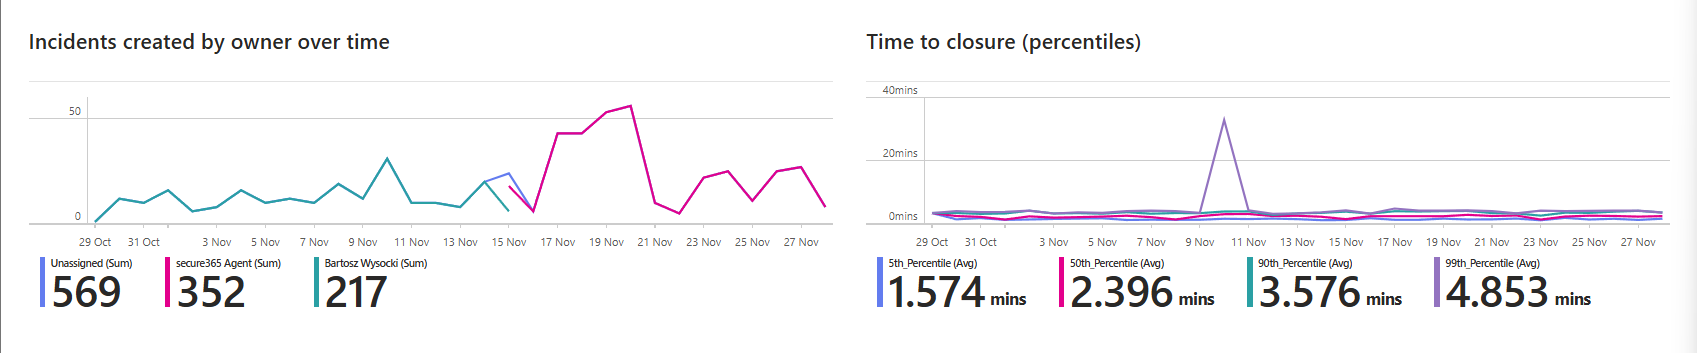
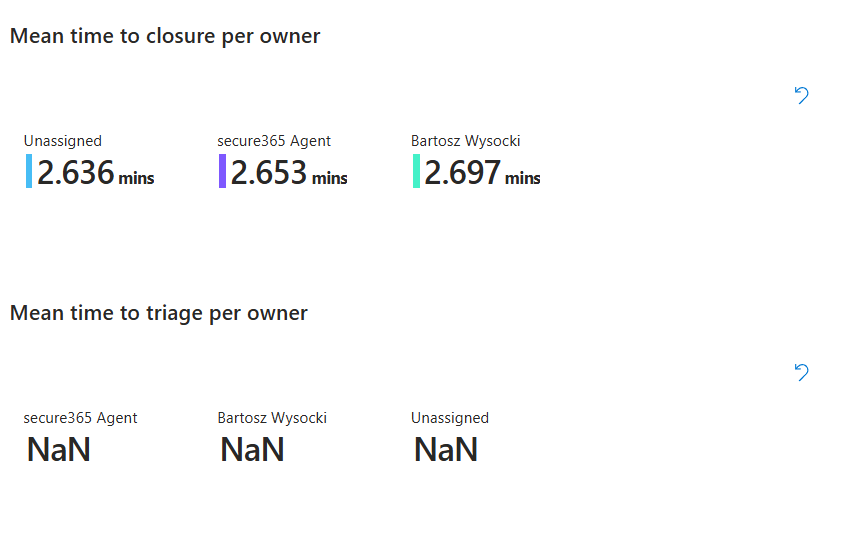
Most useful section: mean time to triage and resolve per owner. Shows which analysts are fastest and which need coaching. Not as punishment but as data. If one person closes incidents 2x faster, that's knowledge you extract and teach the team.
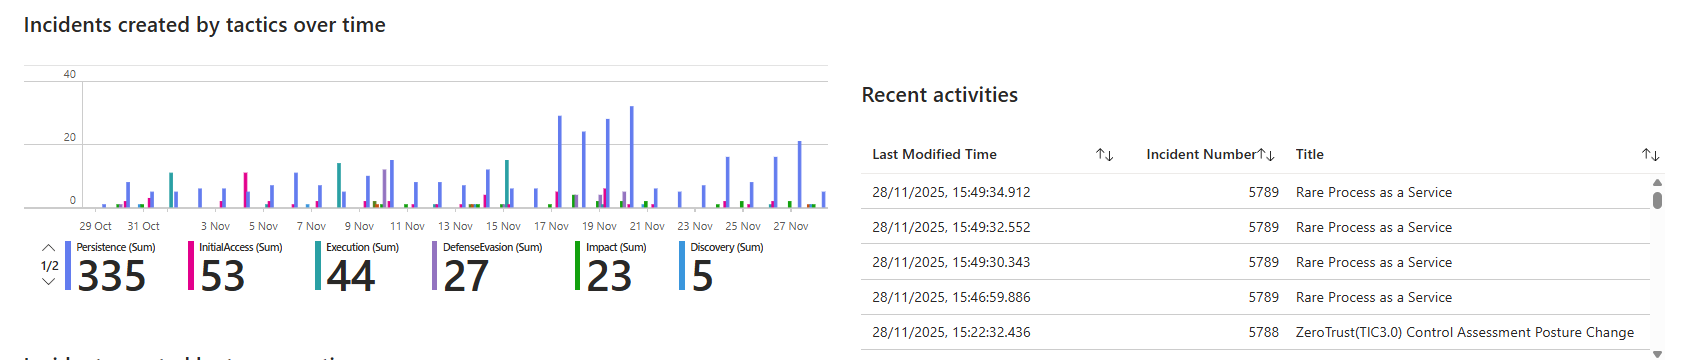
Second useful section: incidents by tactics over time. Shows if your attack surface is shifting. Lots of persistence attacks last week, now it's lateral movement. That tells you where attackers are focusing.
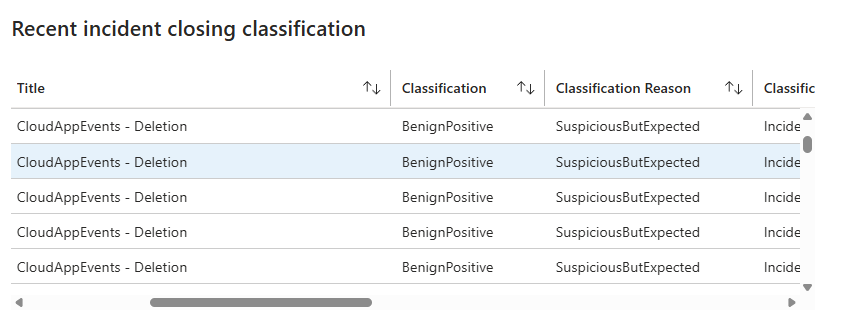
The bottom section shows the recent incident closing classification. Closed manually, closed by automation, detected, etc. This reveals if your playbooks are actually automating triage or if it's all manual work.
Real scenario: management asks why the incident backlog is growing. Pull this workbook, slice by owner and severity, and show them the data. Spot that one team member is swamped while others have bandwidth. Or show that high-severity incidents are taking 3x longer because they're more complex. Now you have a real conversation based on data, not guessing.
Install it, then run it weekly. Use it in team stand-ups to spot trends and celebrate speed improvements.
Install All Three Right Now
Go to Content Hub in Sentinel. Search for each workbook by name. Click Install. Done. You now have three dashboards that cover cost, investigation, and performance.
Use them weekly. Don't wait until there's a crisis to crack them open. Weekly usage means you catch trends early, investigate spikes before they become fires, and track your team's performance continuously.
Class dismissed.