Continuous Export to Log Analytics: Getting Defender for Cloud Data Where You Need It

Alright, class.
You've got Defender for Cloud on. Alerts keep firing. Recommendations keep stacking. Your Secure Score bounces around daily. The problem is all of it sits in the Azure portal doing nothing.
Your SOC team works in Sentinel. They write KQL. They build automation. They don't sit in portals refreshing pages all day. So your Defender data needs to get pulled out and put somewhere Sentinel can grab it.
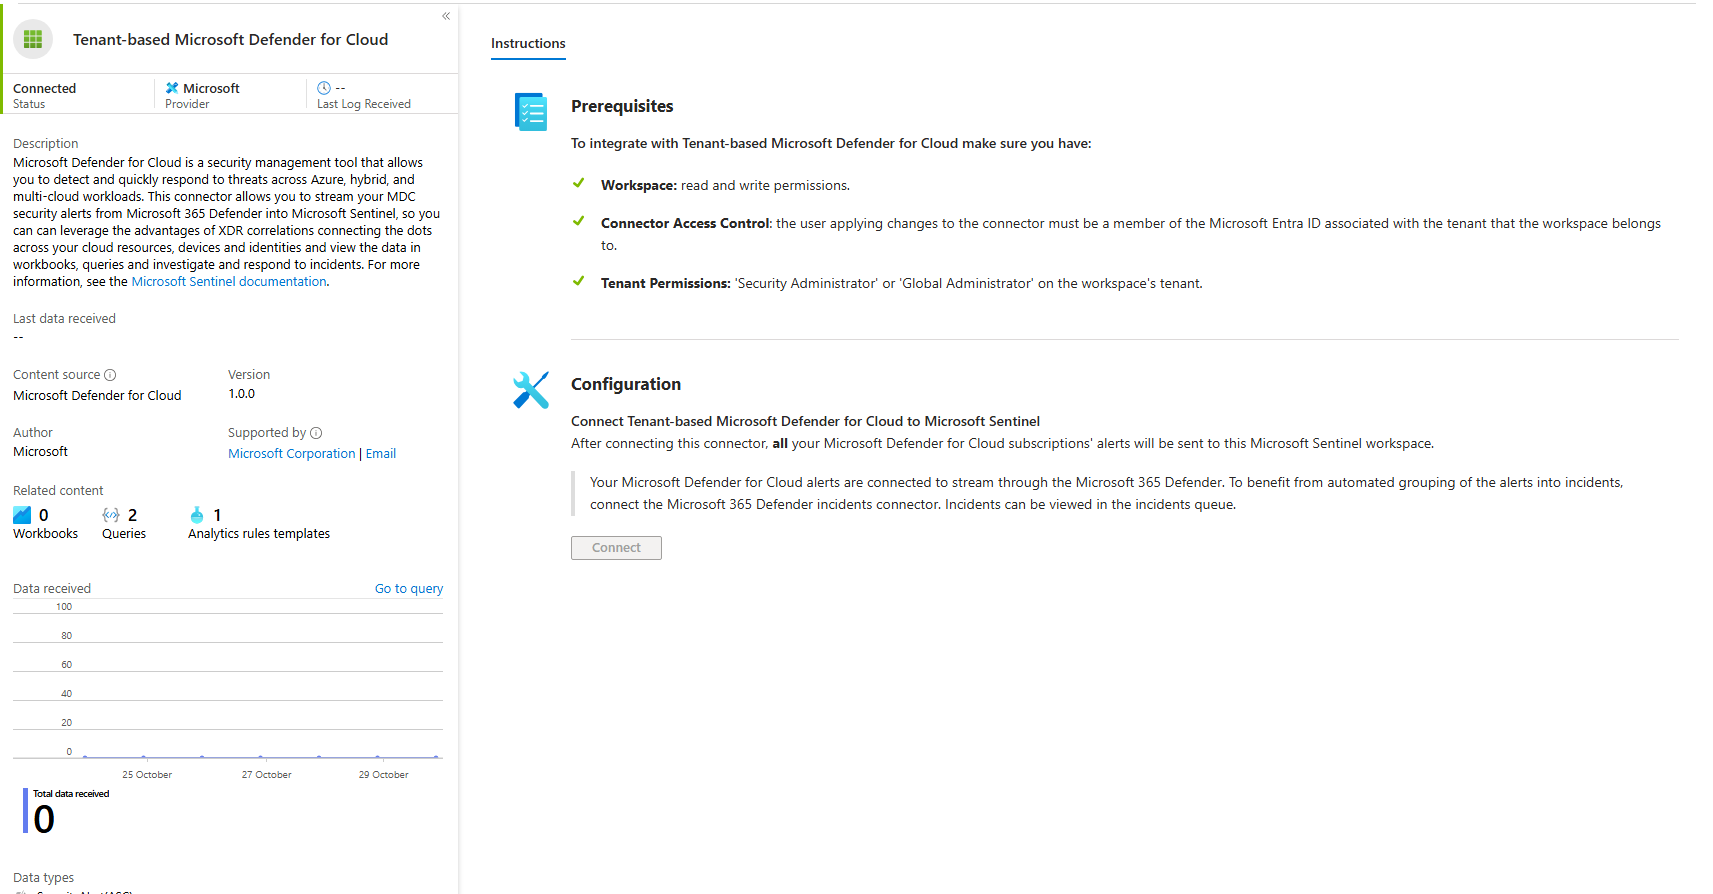
Sentinel already has a Defender for Cloud connector. Pulls alerts straight in. You're getting those without continuous export. So why would you even set it up?
Because the connector only gives you alerts. Continuous export dumps everything. Recommendations, Secure Score trending, attack paths, and compliance assessment details. Every single piece of posture data is queryable in one place.
Connector shows you when an alert fires. Continuous export lets you run a single KQL query asking "give me all resources that currently have a critical alert firing AND an active high-severity recommendation AND are sitting on a critical attack path." One query. Three data sources. Can't do that without continuous export.
Without it, you're checking the portal manually. Are there alerts? Check one page. Are there recommendations? Different page. Attack paths? Third page. Nobody correlates this stuff manually. It's just noise.
With it everything lands in Log Analytics tables. Your team writes actual queries. Gets actual answers.
The Tables You Get
Export puts data in these specific tables:
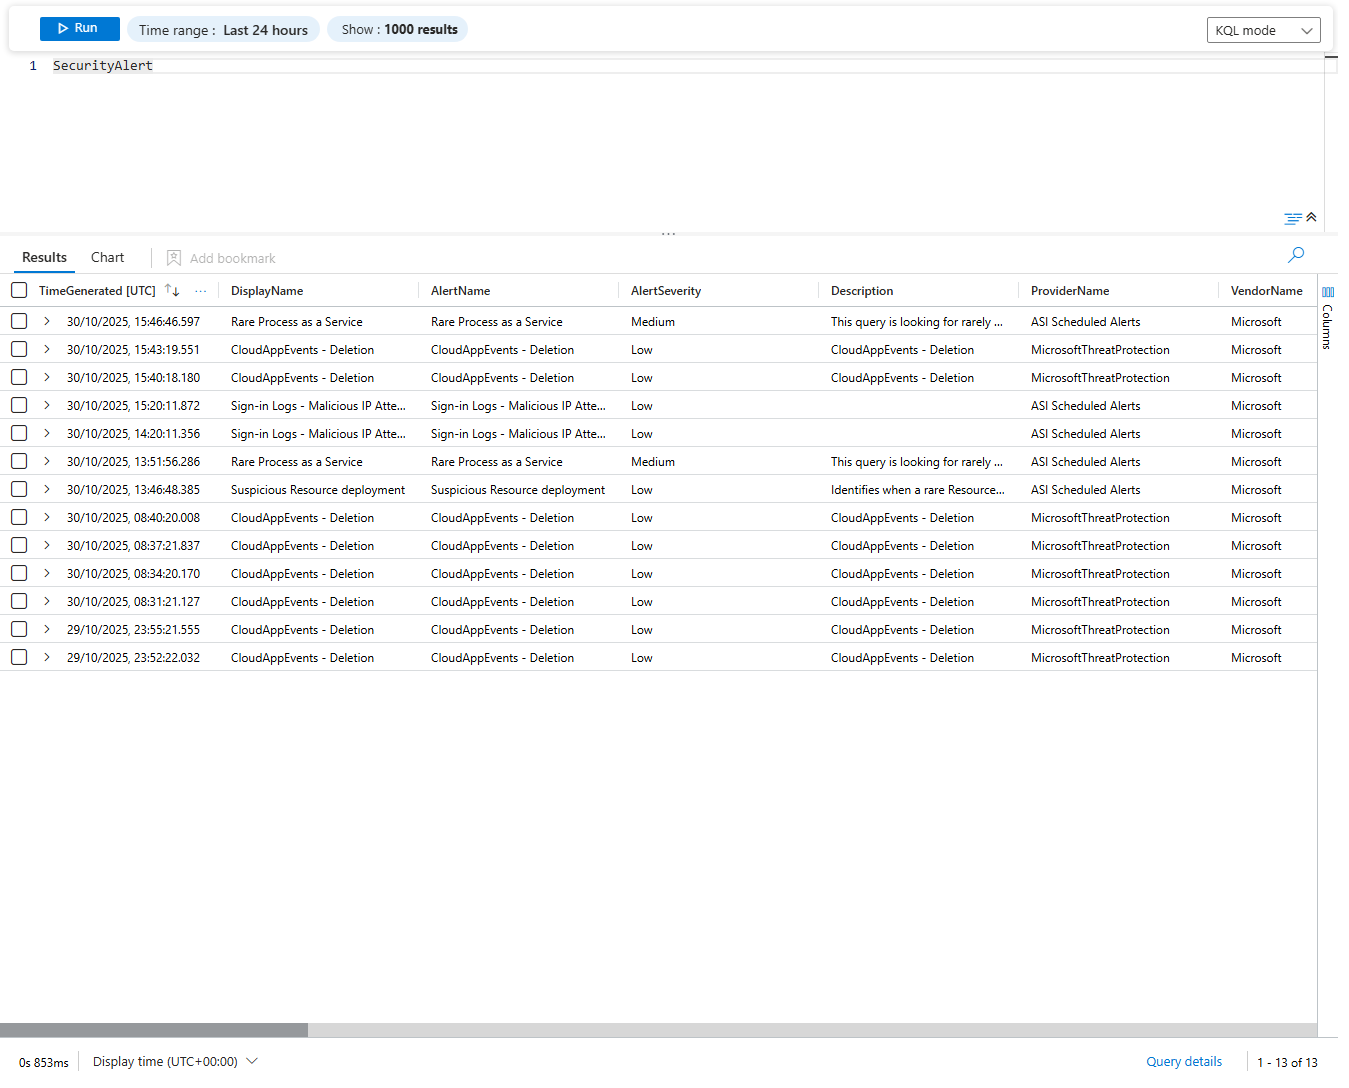
SecurityAlert is where Defender alerts land. Each row is one detection with timestamp, severity, which resource, and what to do about it. Sentinel's connector also puts Defender alerts here, but export ensures everything gets captured.
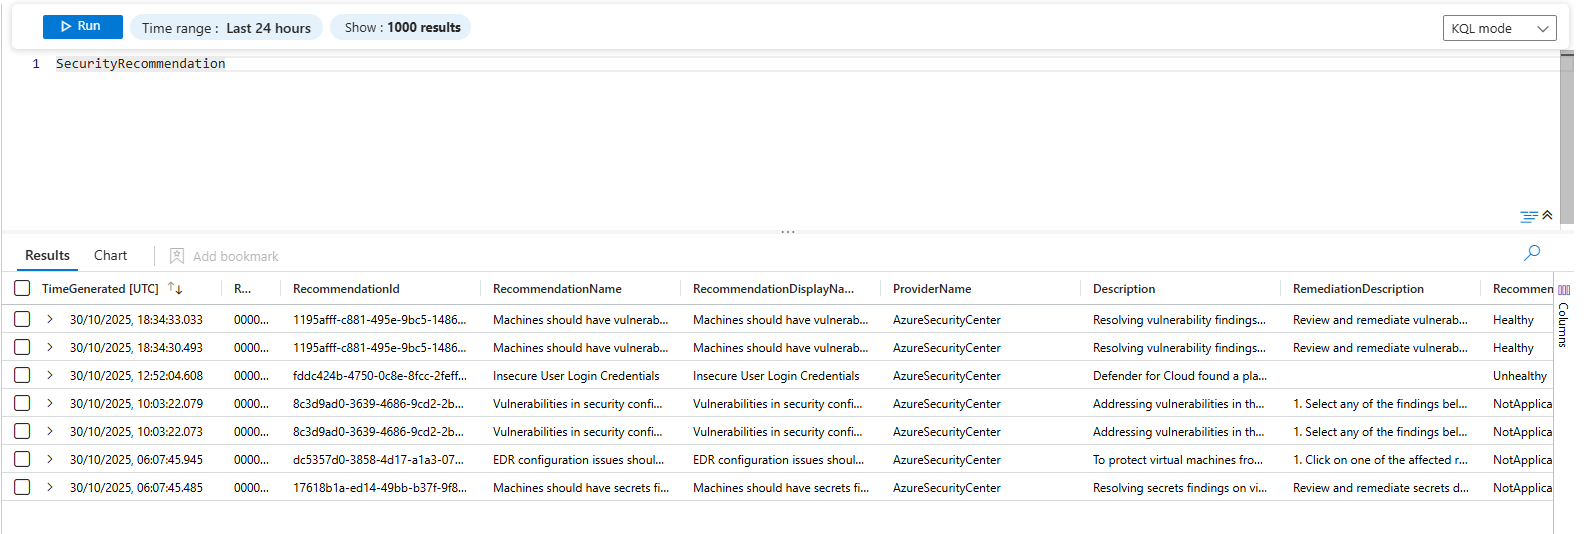
SecurityRecommendation is your posture suggestions. State, severity, which resource, how to fix it.
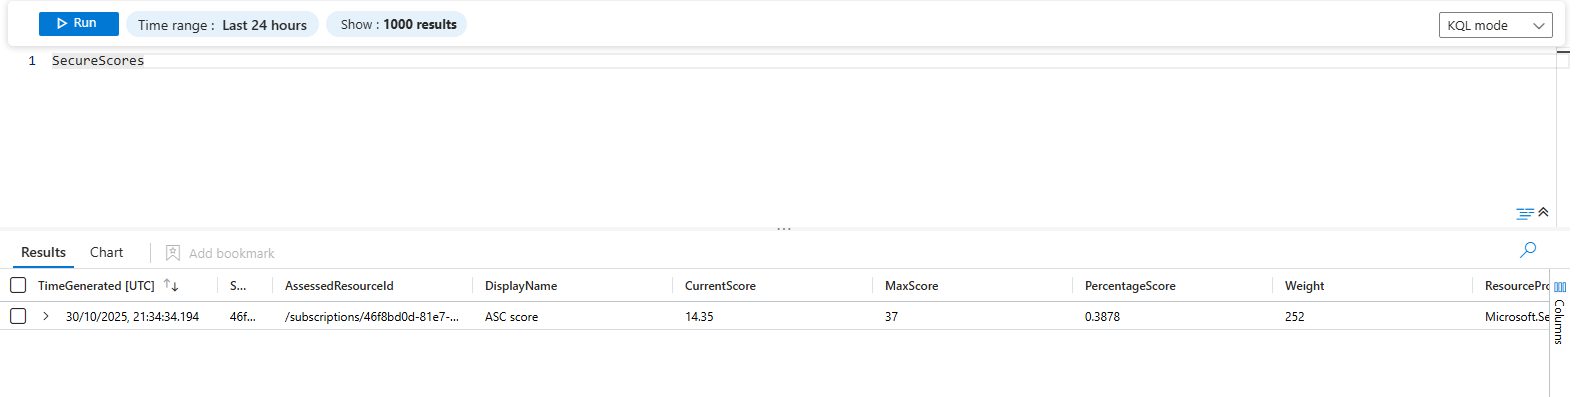
SecureScores tracks your score over time. Use this to see if things are improving or tanking.
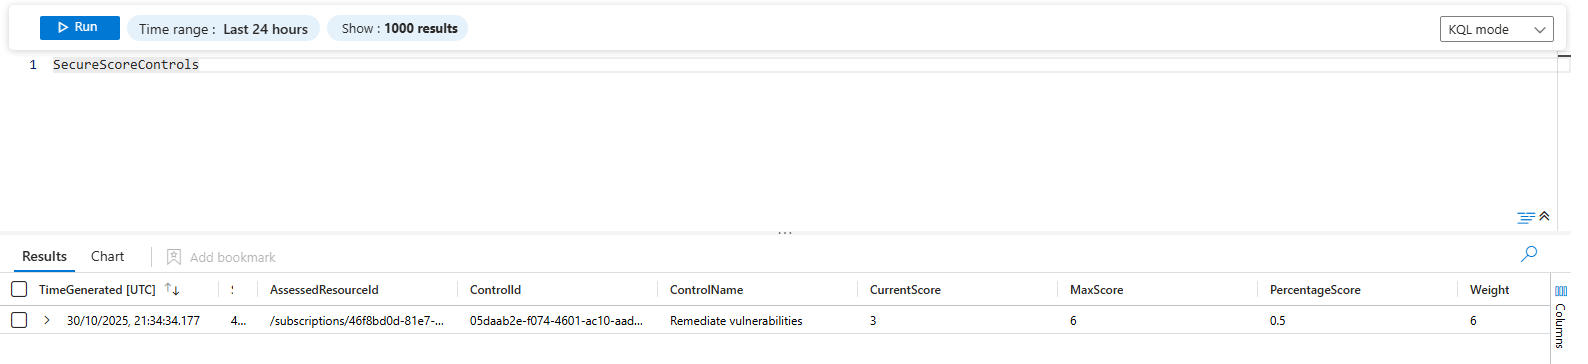
SecureScoreControls breaks down the score by individual control. Shows which specific areas are weak.
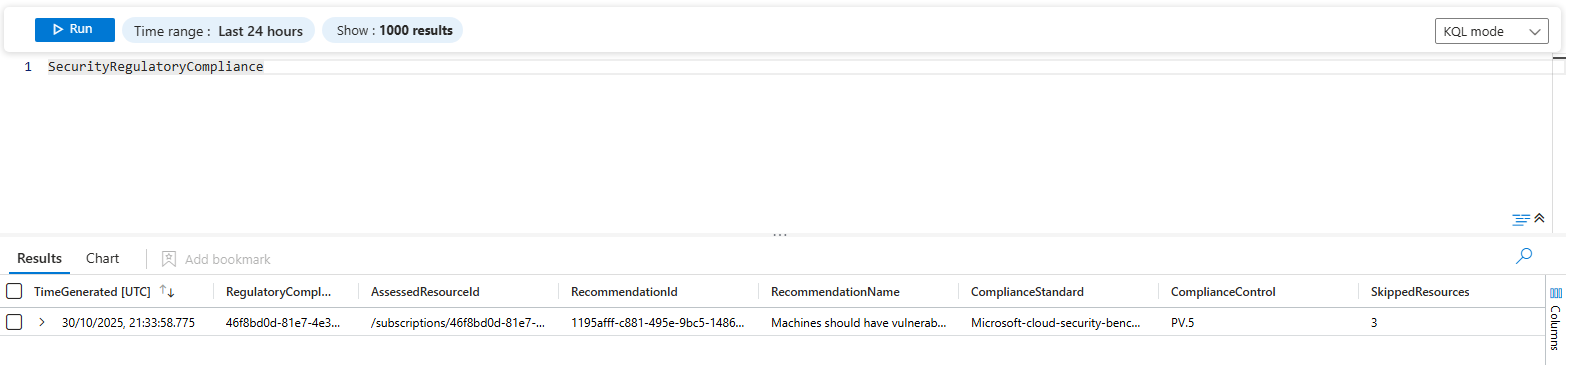
SecurityRegulatoryCompliance high level compliance status per framework.
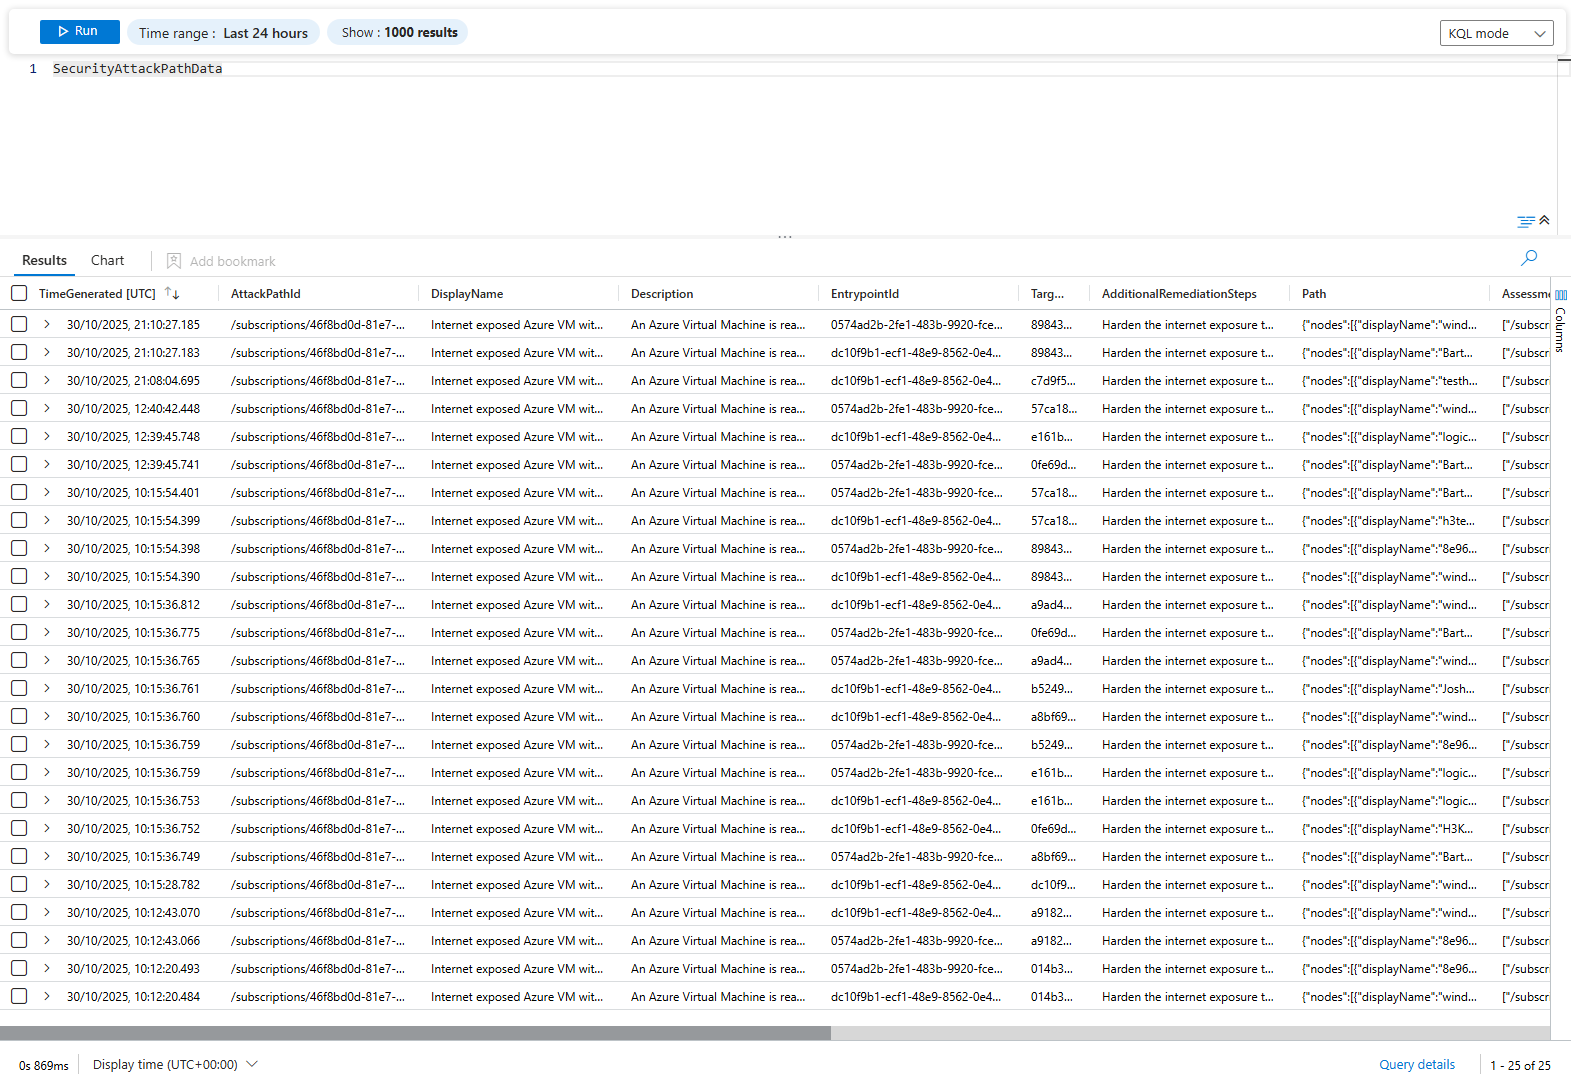
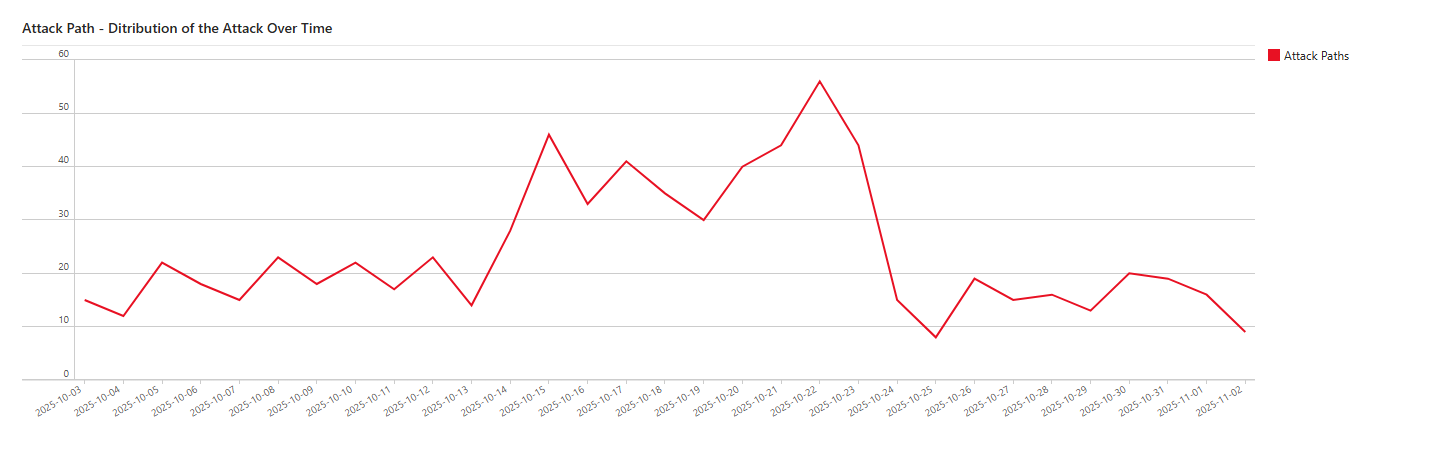
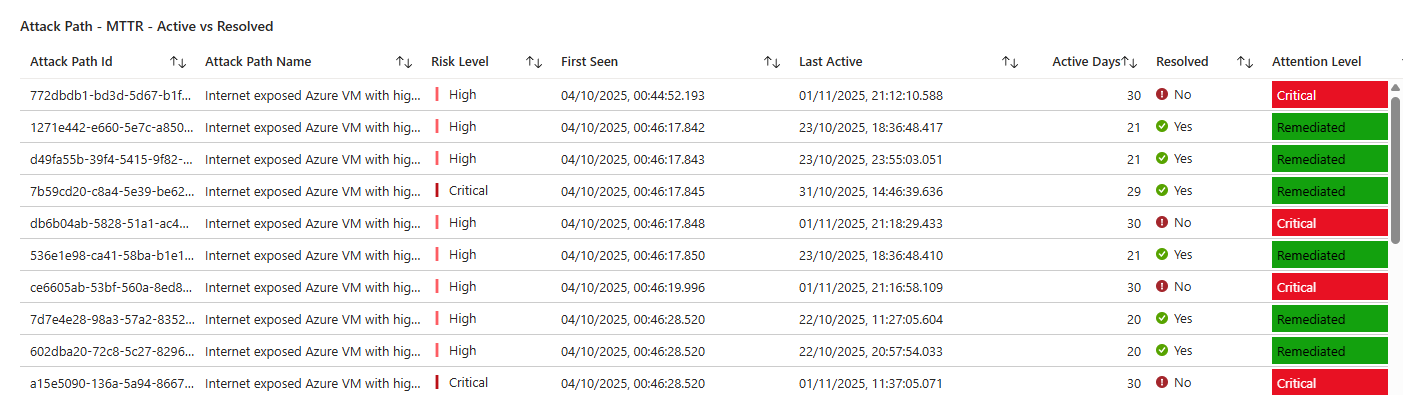
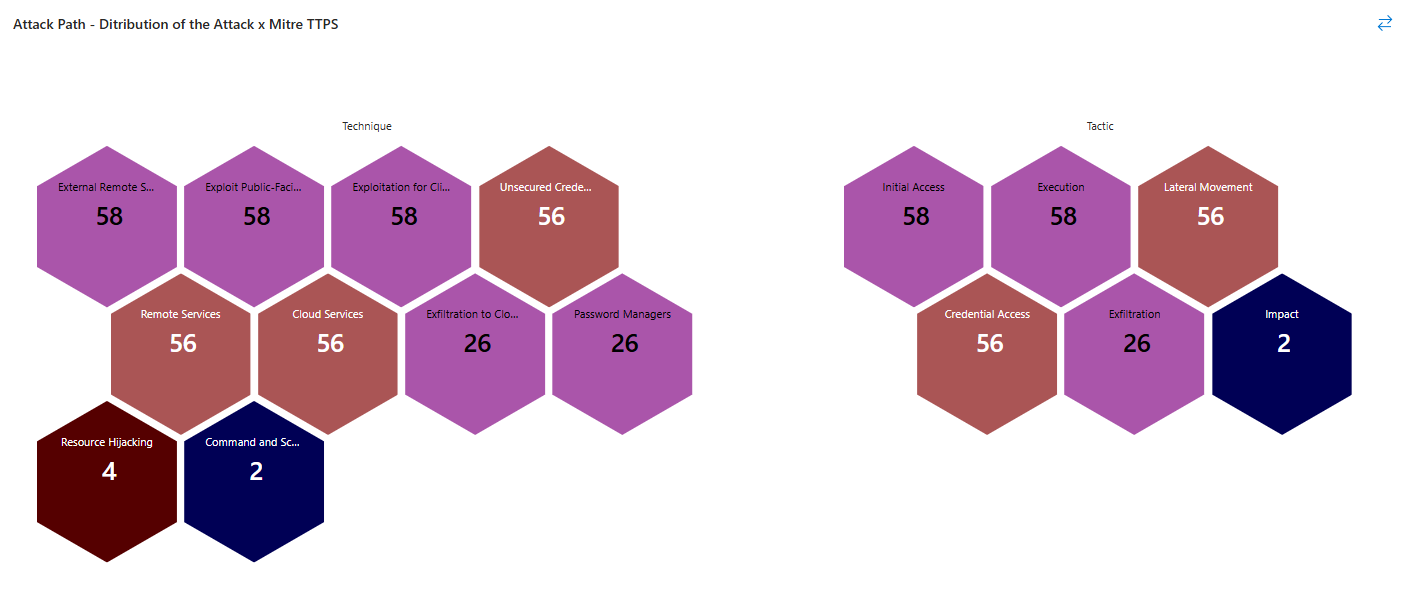
SecurityAttackPathData is the attack chains Defender finds. The storage account is public. Default credentials. Accessible from the internet. That's an attack path. This table has all of them. You can query it like any other table.
Sentinel connects to these automatically. Your team writes KQL against them.
KQL You'll Use
Find alerts by severity and status:
SecurityAlert
| where TimeGenerated > ago(24h)
| where AlertSeverity in ("High", "Medium")
| where Status == "New"
| project TimeGenerated, DisplayName, AlertSeverity, AlertName, ProviderName, Tactics, Techniques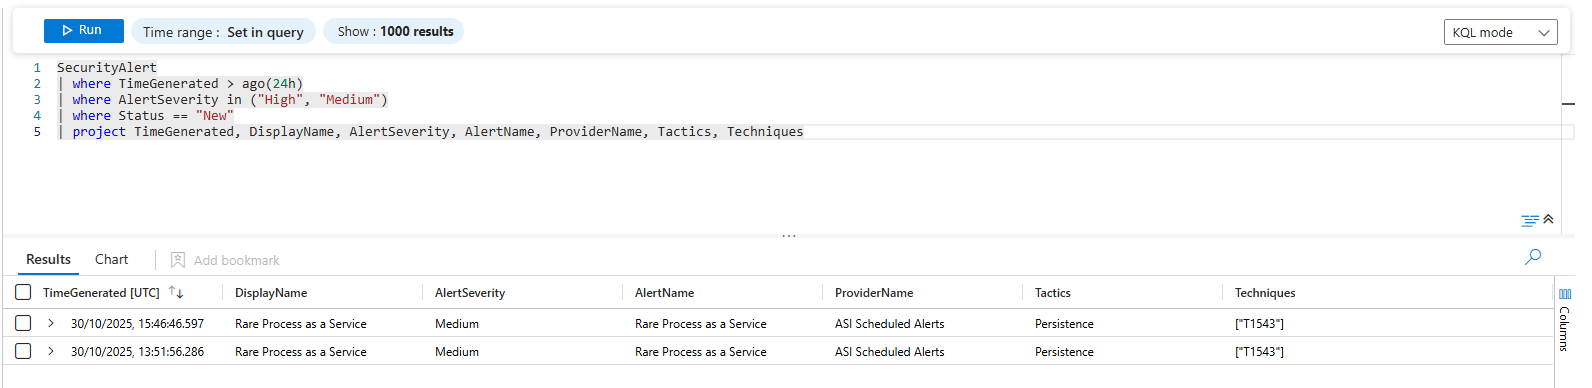
Count alerts by provider:
SecurityAlert
| where TimeGenerated > ago(7d)
| summarize AlertCount = count() by ProviderName, AlertSeverity
| sort by AlertCount desc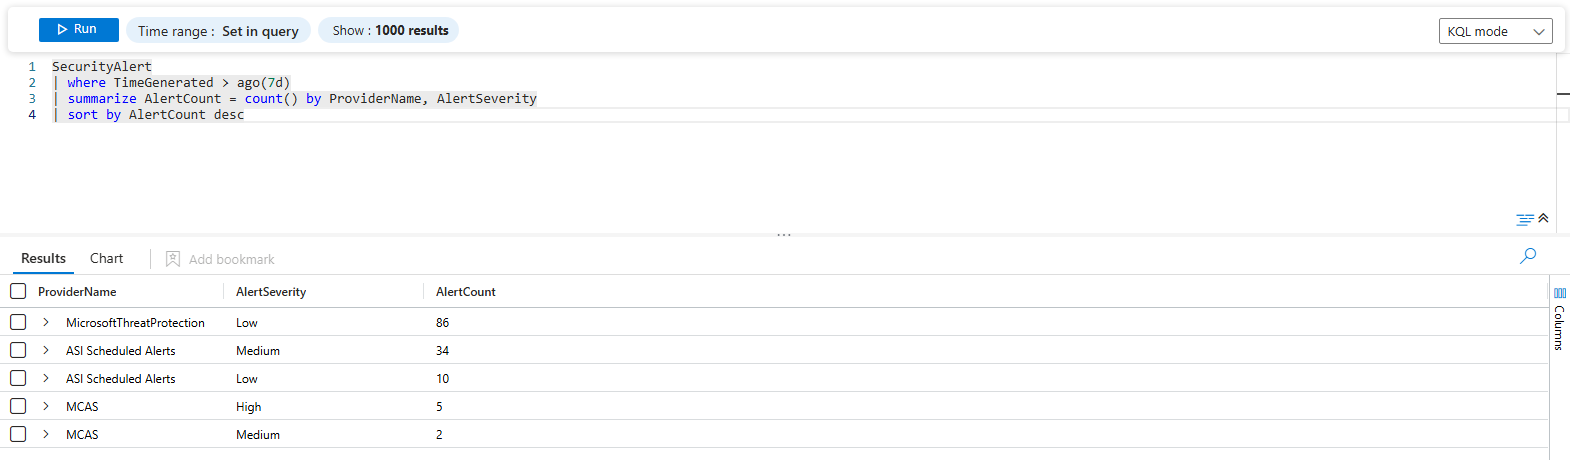
Find alerts from Defender for Endpoint with persistence tactics:
SecurityAlert
| where TimeGenerated > ago(7d)
| where ProviderName == "ASI Scheduled Alerts"
| where Tactics contains "Persistence"
| project TimeGenerated, DisplayName, AlertSeverity, Description, Entities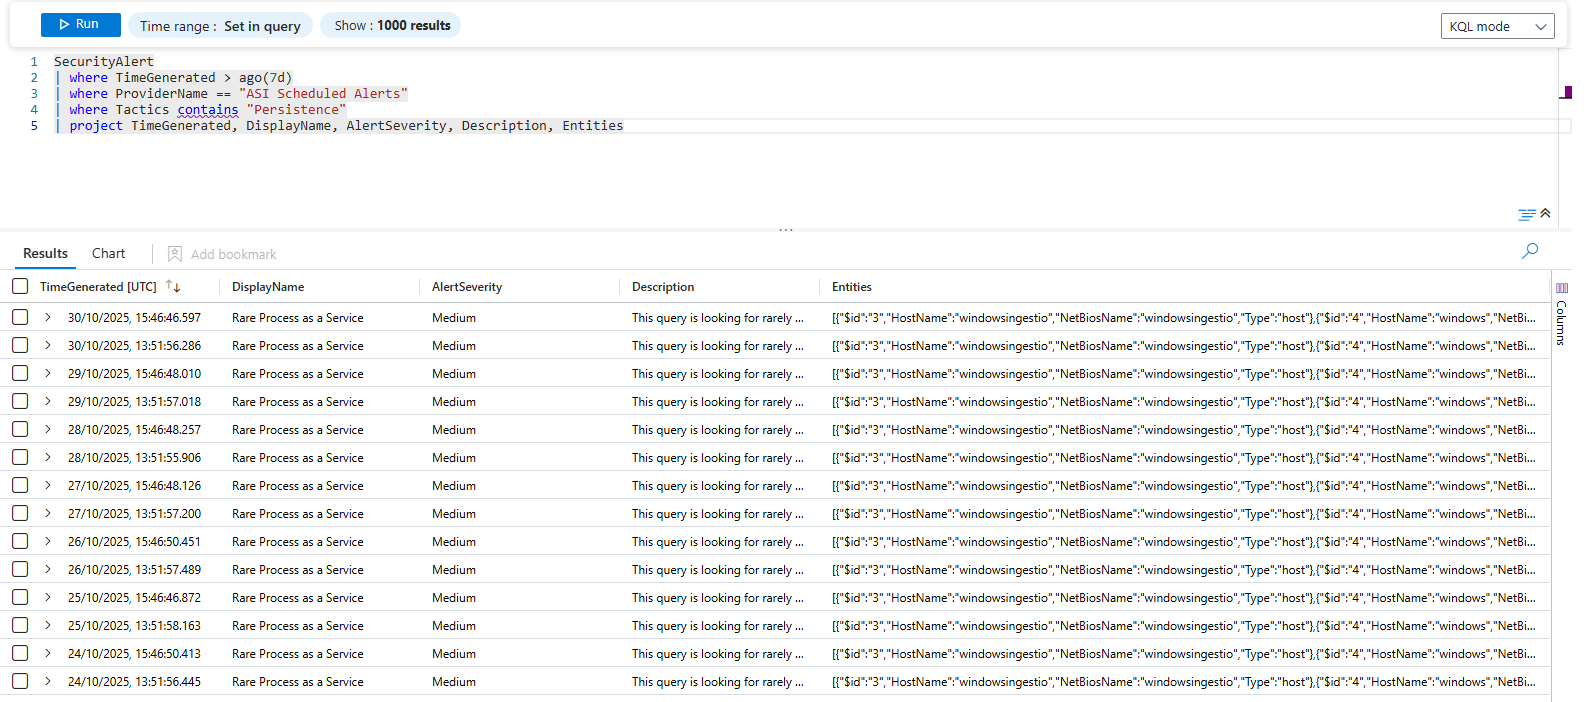
Get alerts with specific MITRE techniques:
SecurityAlert
| where TimeGenerated > ago(14d)
| where Techniques contains "T1165"
| project TimeGenerated, DisplayName, AlertName, AlertSeverity, SubTechniques, ProviderName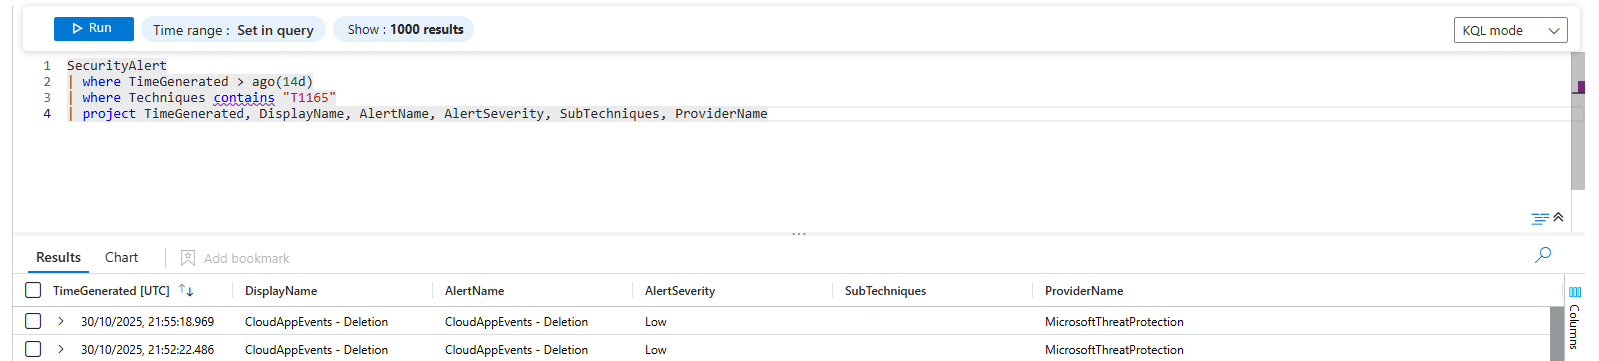
Alert volume trending by provider:
SecurityAlert
| where TimeGenerated > ago(30d)
| summarize AlertCount = count() by bin(TimeGenerated, 1d), ProviderName
| render timechart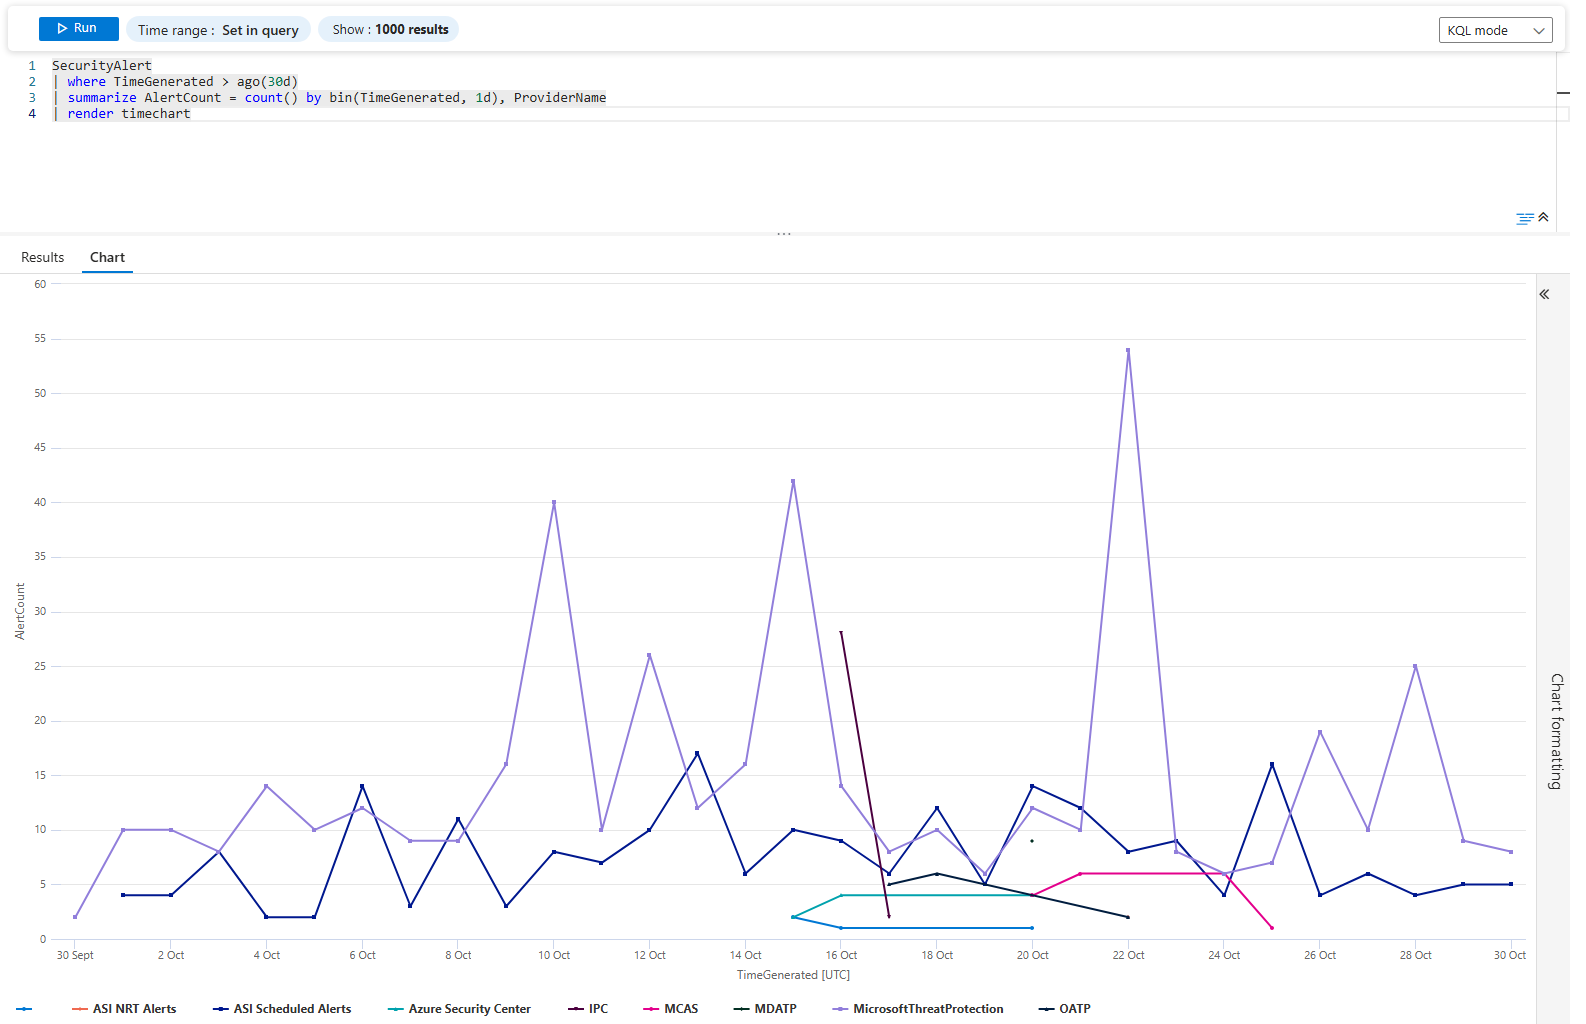
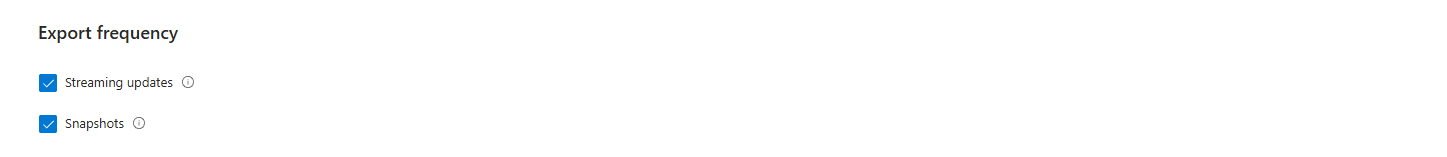
Streaming vs Snapshots
Two options. Completely different purposes.
Streaming means the data goes out immediately. Alert fires, it's in Log Analytics in seconds (you can also use Data Connector instead of Continuous export for this specific case, which I highly recommend). Sentinel picks it up right away. This is for incident response. This is what you want for alerts and recommendations.
Snapshots are weekly dumps. Everything at once. Compliance data, scores, everything. Good for compliance reporting. Worthless for actual incidents. By the time the weekly dump runs, the attack is already over.
Luckily, you can get the best from both worlds - select both options 😼
Connect it
Open your Defender for Cloud and navigate to Environment settings > Subscription > Continuous export
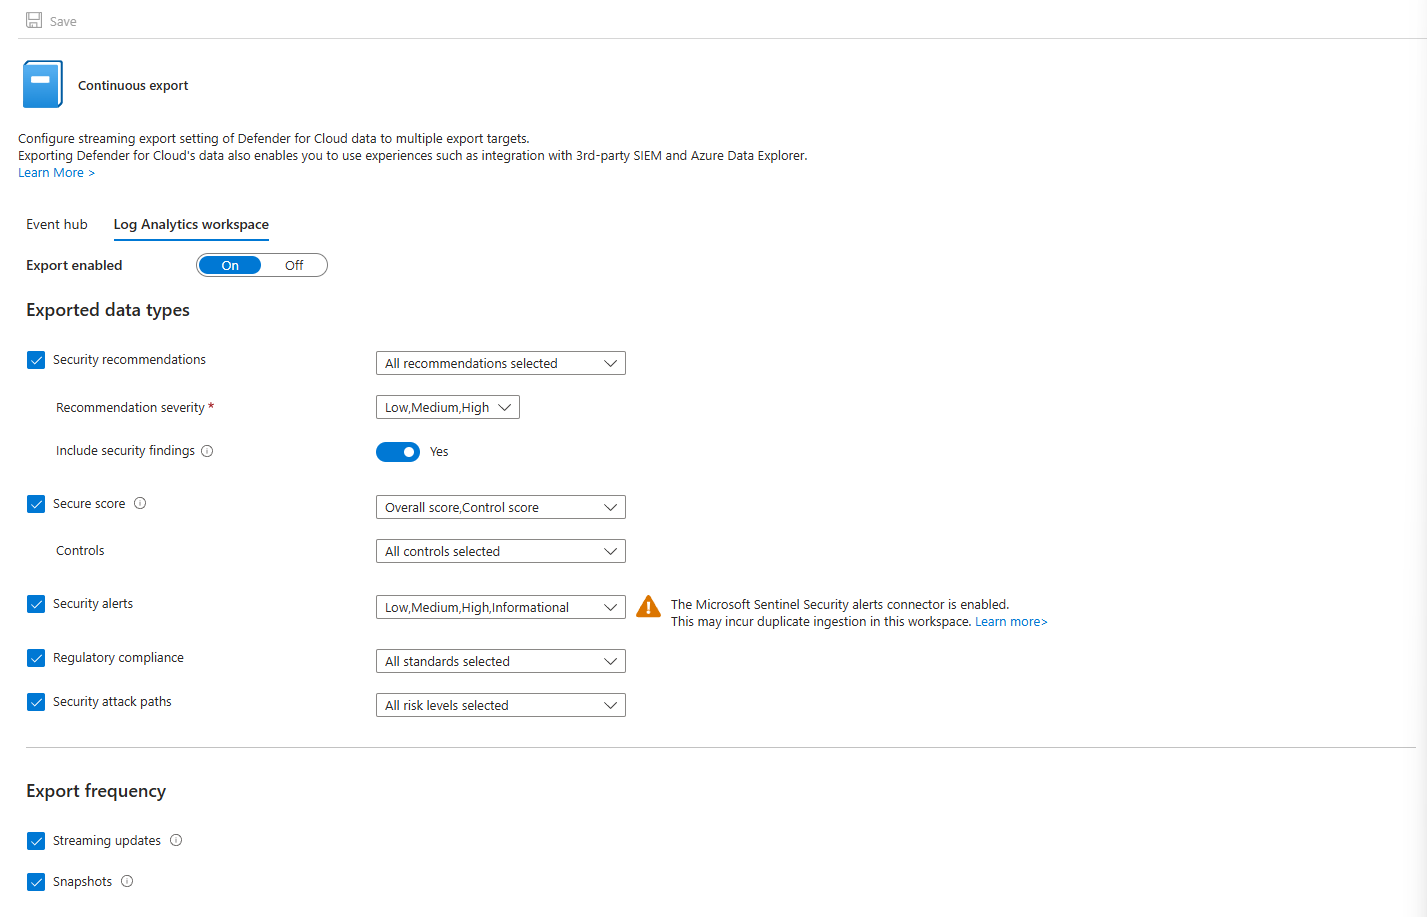
Select the options you are interested in under Log Analytics Workspace and save it
Actually Using It
Export is just infrastructure. The real work is what you do with the data.
Your team writes KQL queries in Sentinel that hunt across Defender data. Find patterns. Find chains. Find resources showing up in multiple alert types.
What I would always recommend doing first is to look at the ready workbooks for Defender for Cloud, you will be surprised on how many useful information you can get out of them!
Class dismissed.