A SOC Analyst's Introduction to Defender for Cloud Apps

Alright, class. Take your seats.
Let's talk about a problem that keeps every security professional up at night. It's not the alerts you see; it's the activity you don't. You've secured your endpoints with Defender for Endpoint (MDE). You've centralised your logs in Sentinel. You feel like you have a handle on things. Then, an employee in the marketing department signs up for a trendy new file-sharing service called super-fast-files.io using their corporate credentials. They upload the entire confidential Q3 launch plan.
You don't get an alert. MDE doesn't see a malicious process. Sentinel sees nothing but normal HTTPS traffic to an unknown IP. As far as your security stack is concerned, nothing happened. Yet, your company's sensitive information is now sitting on a server in a country with questionable data privacy laws, managed by a company that's probably just two guys in a garage.
This is Shadow IT. And it is, without a doubt, one of the biggest blind spots in modern security.
Today, we're building the lookout tower. We're going to talk about Microsoft Defender for Cloud Apps (MDCA), the tool designed specifically to shine a massive, high-powered spotlight into these dark corners. Sit down, and relax to find out: what MDCA is, why you desperately need it, and how to get the lights on.
The "Why": What Problem Are We Actually Solving?
In the old days, our job was simpler. We built a big wall, the corporate network, and watched everything that went in and out. If an application wasn't installed by IT on a corporate device, it didn't exist.
That world is dead. Today, your data doesn't live within your walls. It lives in Office 365, Google Drive, Salesforce, Slack, Dropbox, and a thousand other SaaS applications. Your users can access this data from anywhere, and they can sign up for new services with a single click.
Defender for Cloud Apps is a Cloud Access Security Broker (CASB). That's a fancy acronym, but its job is simple: to give you back the visibility and control you lost when your data moved to the cloud. It answers three fundamental questions:
- Discovery: What cloud apps are my users actually using? (The answer will surprise and horrify you.)
- Protection: Can I stop users from uploading sensitive data to risky apps?
- Governance: Can I control which apps are allowed and which are forbidden?
For a SOC analyst, the "why" is even simpler: MDCA generates alerts and provides critical context that you can't get from any other source. When you see an alert for "Failed user logon attempts to an app" or "Mass download" that came from MDCA. Without it, you're flying half-blind.
The "How": Flipping the Switch with Defender for Endpoint
So, how do we get this magical visibility? Are we deploying yet another agent to our already overburdened endpoints?
No. And this is the most beautiful part of the Microsoft stack. You already have the agent: Defender for Endpoint. The integration is a symbiotic relationship. MDE is the soldier on the ground, monitoring every network connection a device makes. MDCA is the general in the command tent. All you have to do is order the soldier to start reporting back.
Enabling this is almost insultingly simple. You're just flipping a switch.
- Navigate to your Microsoft Defender portal (
security.microsoft.com). - Go to Settings > Endpoints > Advanced features.
- Scroll down until you find Microsoft Defender for Cloud Apps.
- Toggle the switch to On.
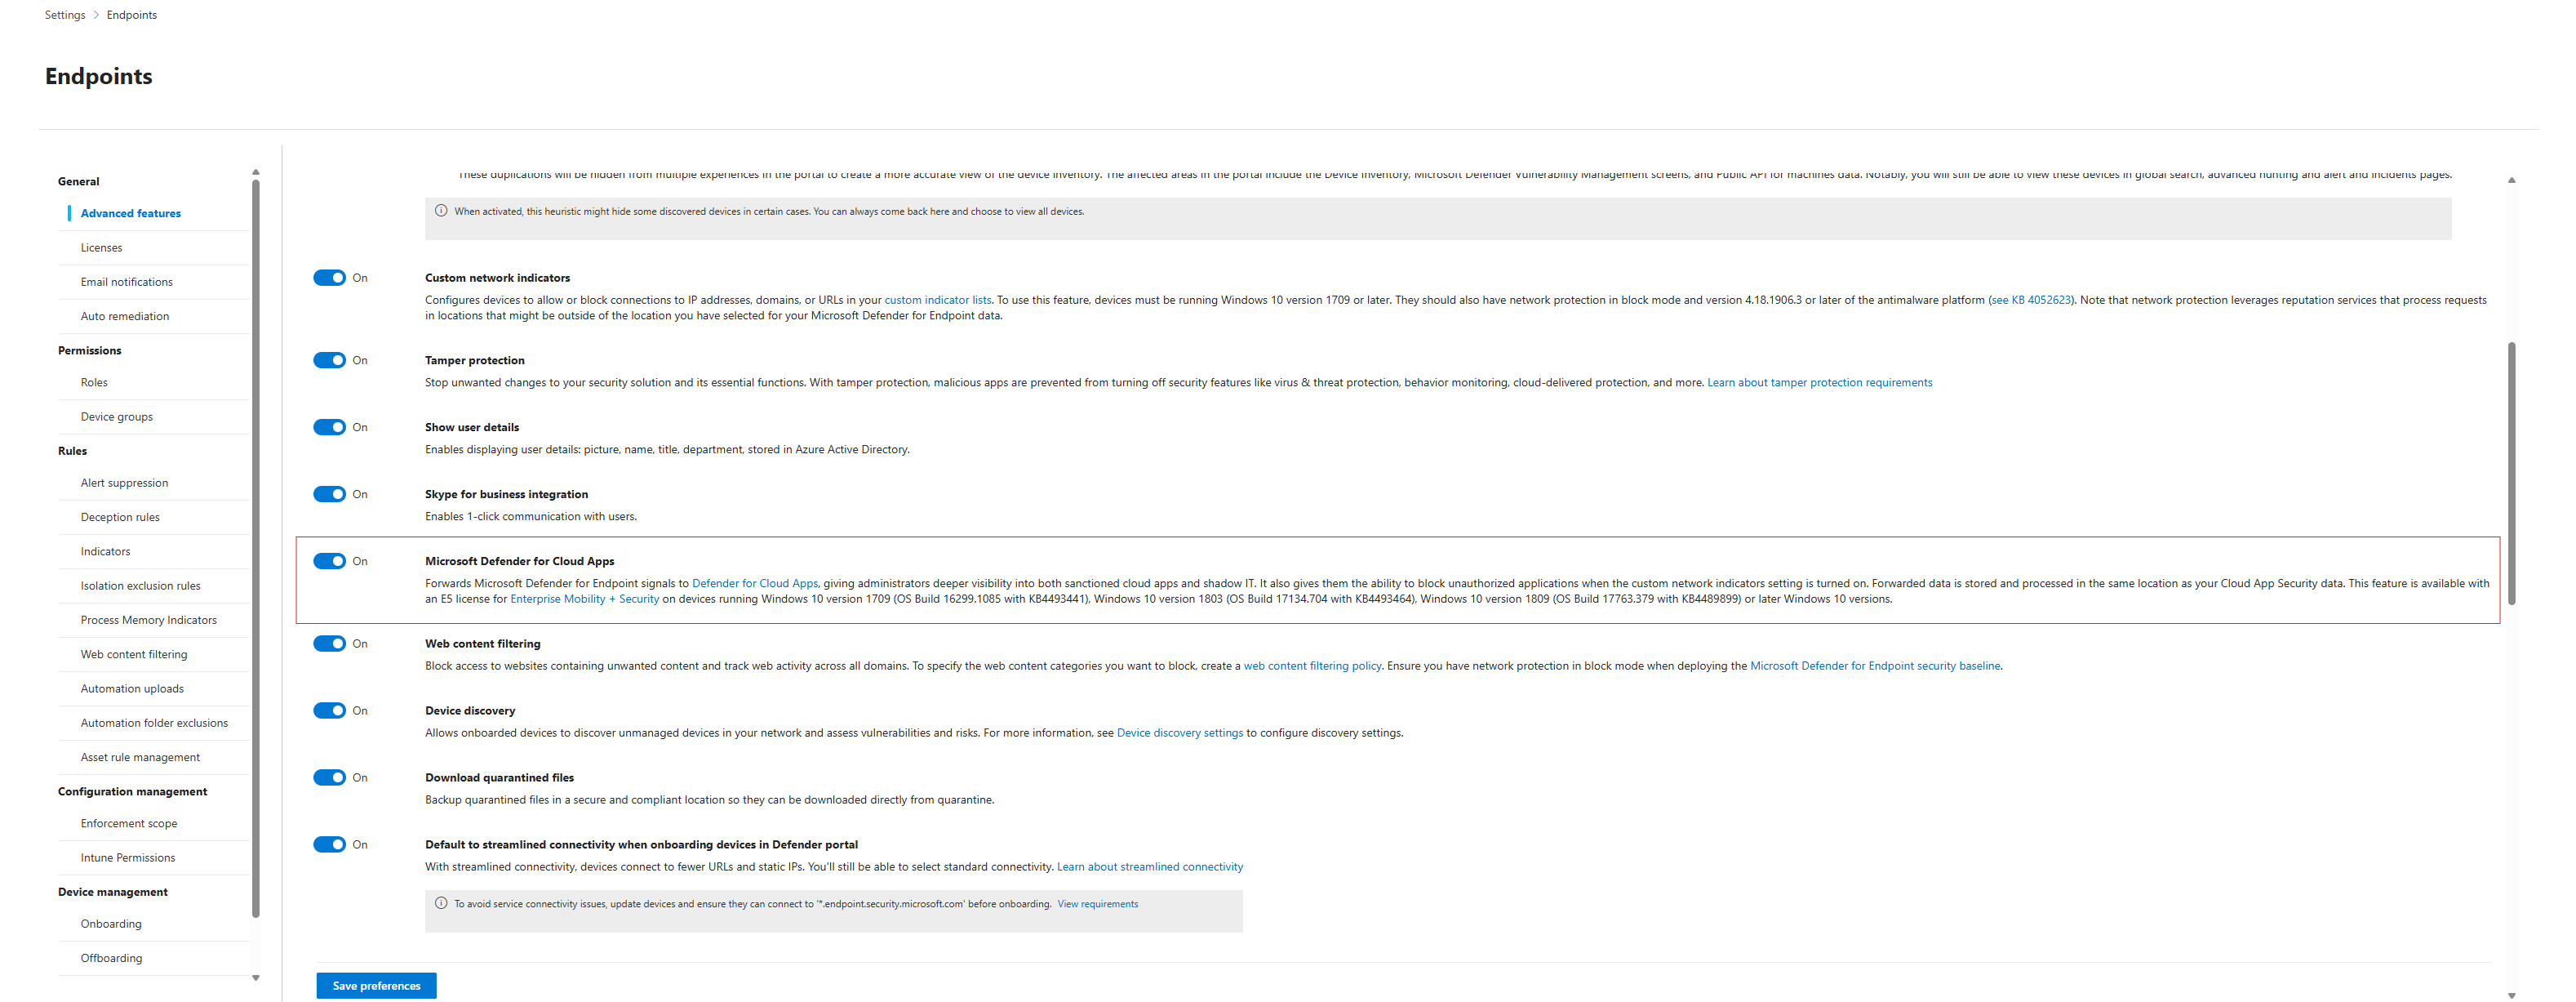
That's it. You're done.
By flipping this switch, you've instructed every MDE-enrolled device in your fleet to start forwarding its network traffic signals to the MDCA service. MDCA then takes this raw data, compares it against its massive catalogue of over 31,000 cloud apps, and begins building a picture of your organisation's Shadow IT. No new agents, no network taps, no complex configuration. It just works.
The First Discovery: The View from the Lookout Tower
After you've enabled the integration and let it run for a day or two, it's time to see what it found. Navigate to the Cloud Discovery dashboard in Defender for Cloud Apps.
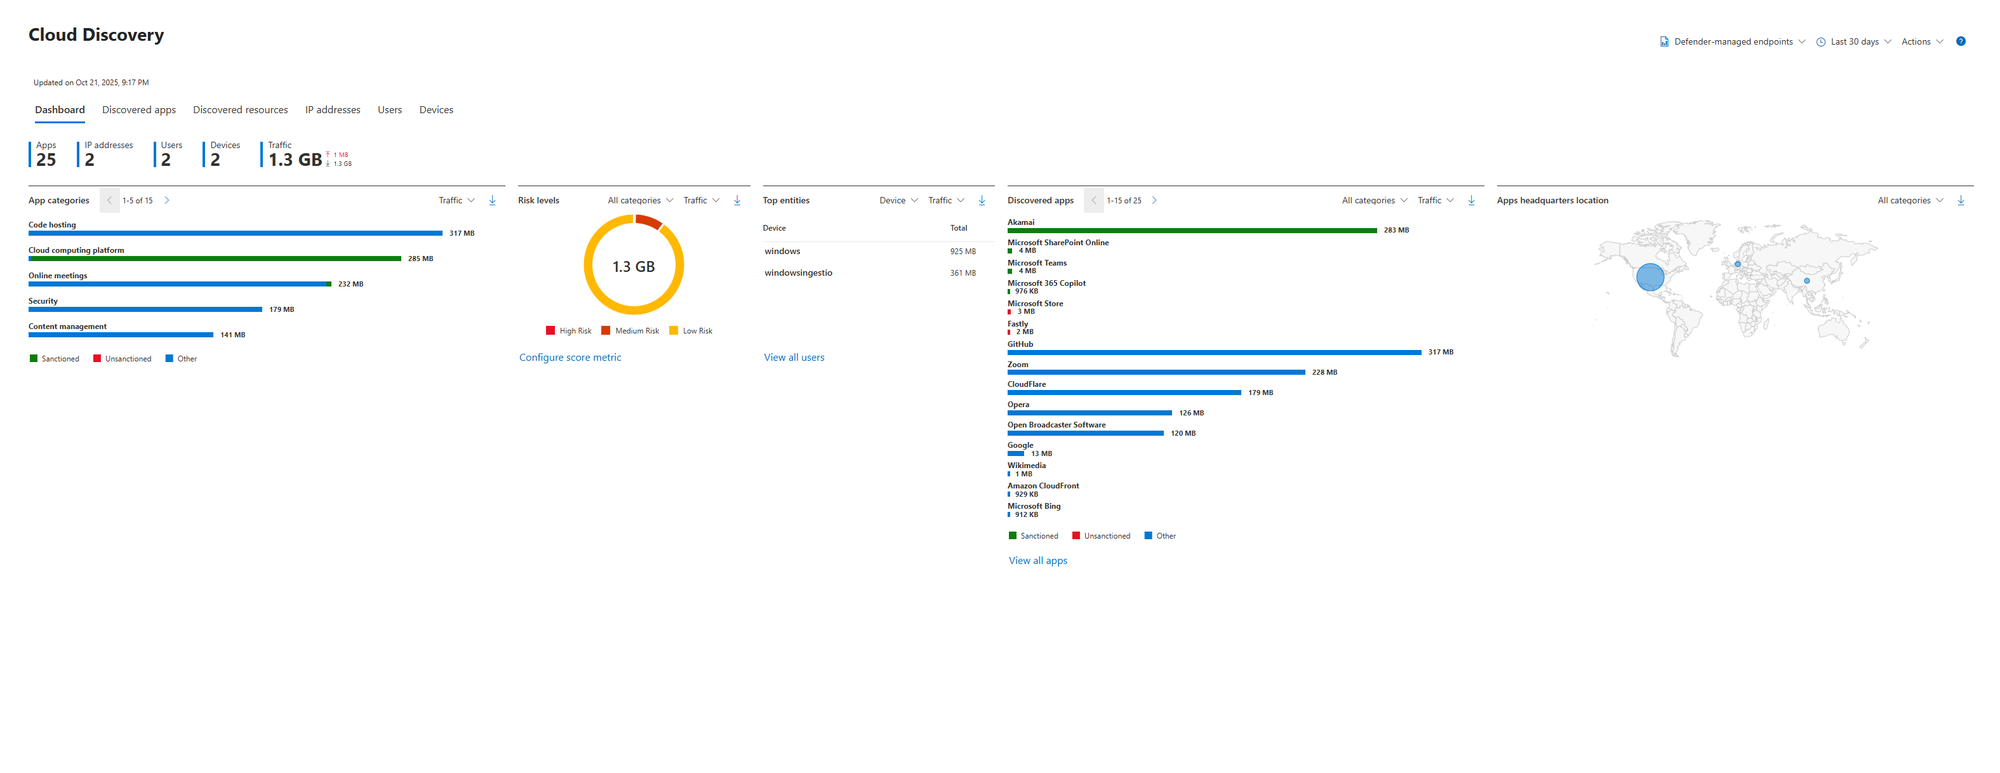
Prepare yourself. This is often a humbling experience for any organisation. You thought your users were only using Office 365? This dashboard will show you the 25, 50, or even hundreds of other services they're touching.
Here’s what you’re looking at:
- High-Level Stats (Apps, IPs, Users, Devices): Your immediate at-a-glance numbers.
- Traffic: How much of your corporate data is flowing into these cloud services? Seeing gigabytes of data going to apps you've never heard of is a powerful motivator.
- Risk Levels: This is your first triage point. MDCA automatically categorises apps into "high," "medium," and "low" risk based on over 90 factors, including their security certifications, legal policies, and data handling practices.
- App Headquarters Location: A world map showing where these cloud apps are legally headquartered. This is critical for data sovereignty and compliance (e.g., GDPR). If you're a European company and see lots of data flowing to apps hosted in Russia or China, that’s an immediate conversation starter.
The Core Workflow: Taming Shadow IT with Sanction, Unsanction, and Monitor
The dashboard gives you the big picture, but the real work happens in the Discovered apps tab. This is your living, breathing inventory of every cloud service in use.
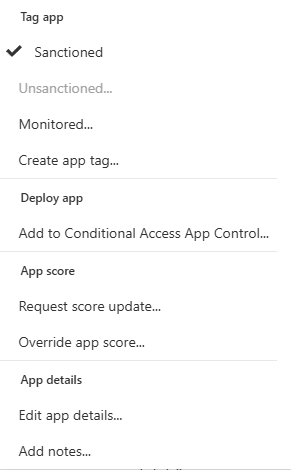
For every single app on this list, from wetransfer.com to tiktok.com you have a decision to make. MDCA gives you three simple but powerful governance actions to take. You apply them by "tagging" the app.
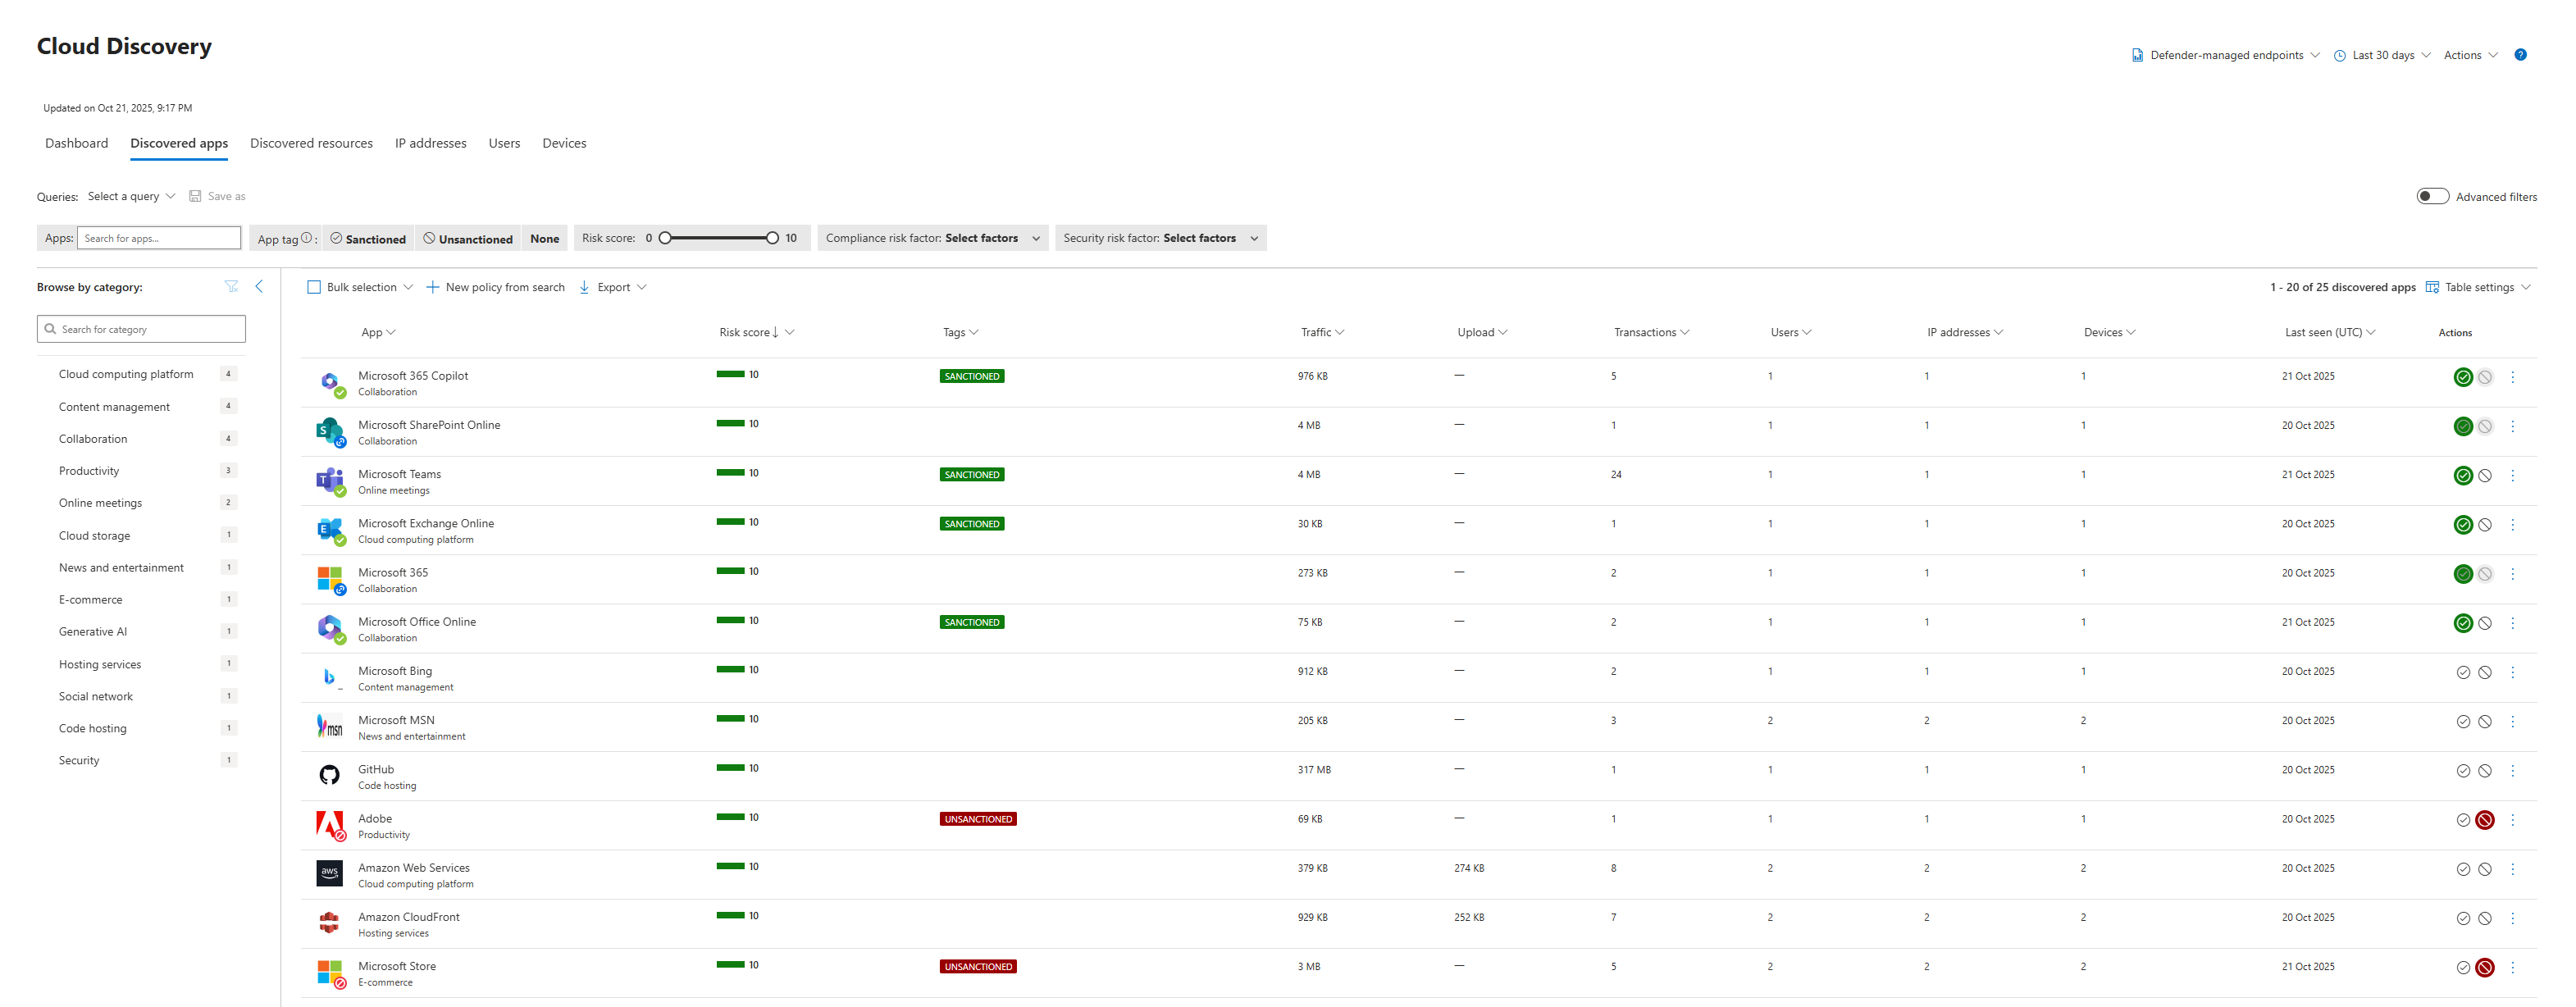
- Tag as "Sanctioned" (The Green Light): This is you, the IT Professor, officially blessing an application. You're saying, "This is an approved, corporate standard. We trust it." Your Office 365 suite, your corporate HR system, your approved CRM these all get the "Sanctioned" tag. This tells the system to treat activity here as normal.
- Tag as "Unsanctioned" (The Red Light): This is you bringing down the hammer. You're saying, "This application is explicitly forbidden. It is high-risk, non-compliant, or just plain sketchy, and it has no place in our environment." When you tag an app as "Unsanctioned," you're not just making a note. This tag becomes a powerful signal. You can configure Defender for Endpoint to use this tag to actively block access to that app on all your managed devices. This is how you move from discovery to enforcement.
- Monitor (The Yellow Light): What about everything in between? That's where monitoring comes in. By not applying a tag (or creating a custom tag like "Under Review"), you're essentially saying, "I see you. I'm not blocking you yet, but I'm watching." That new AI design tool Marketing is using? You can leave it untagged and monitor its usage. If it stays confined to a small group, maybe it's fine. If half the company starts uploading data to it, it might be time to tag it as "Unsanctioned" or begin the process of officially "Sanctioning" it.
This simple loop - Discover, Assess Risk, and then Sanction/Unsanction/Monitor, is the bread and butter of managing Shadow IT. It's how you methodically turn the chaos of unknown apps into a governed, risk-managed cloud environment.
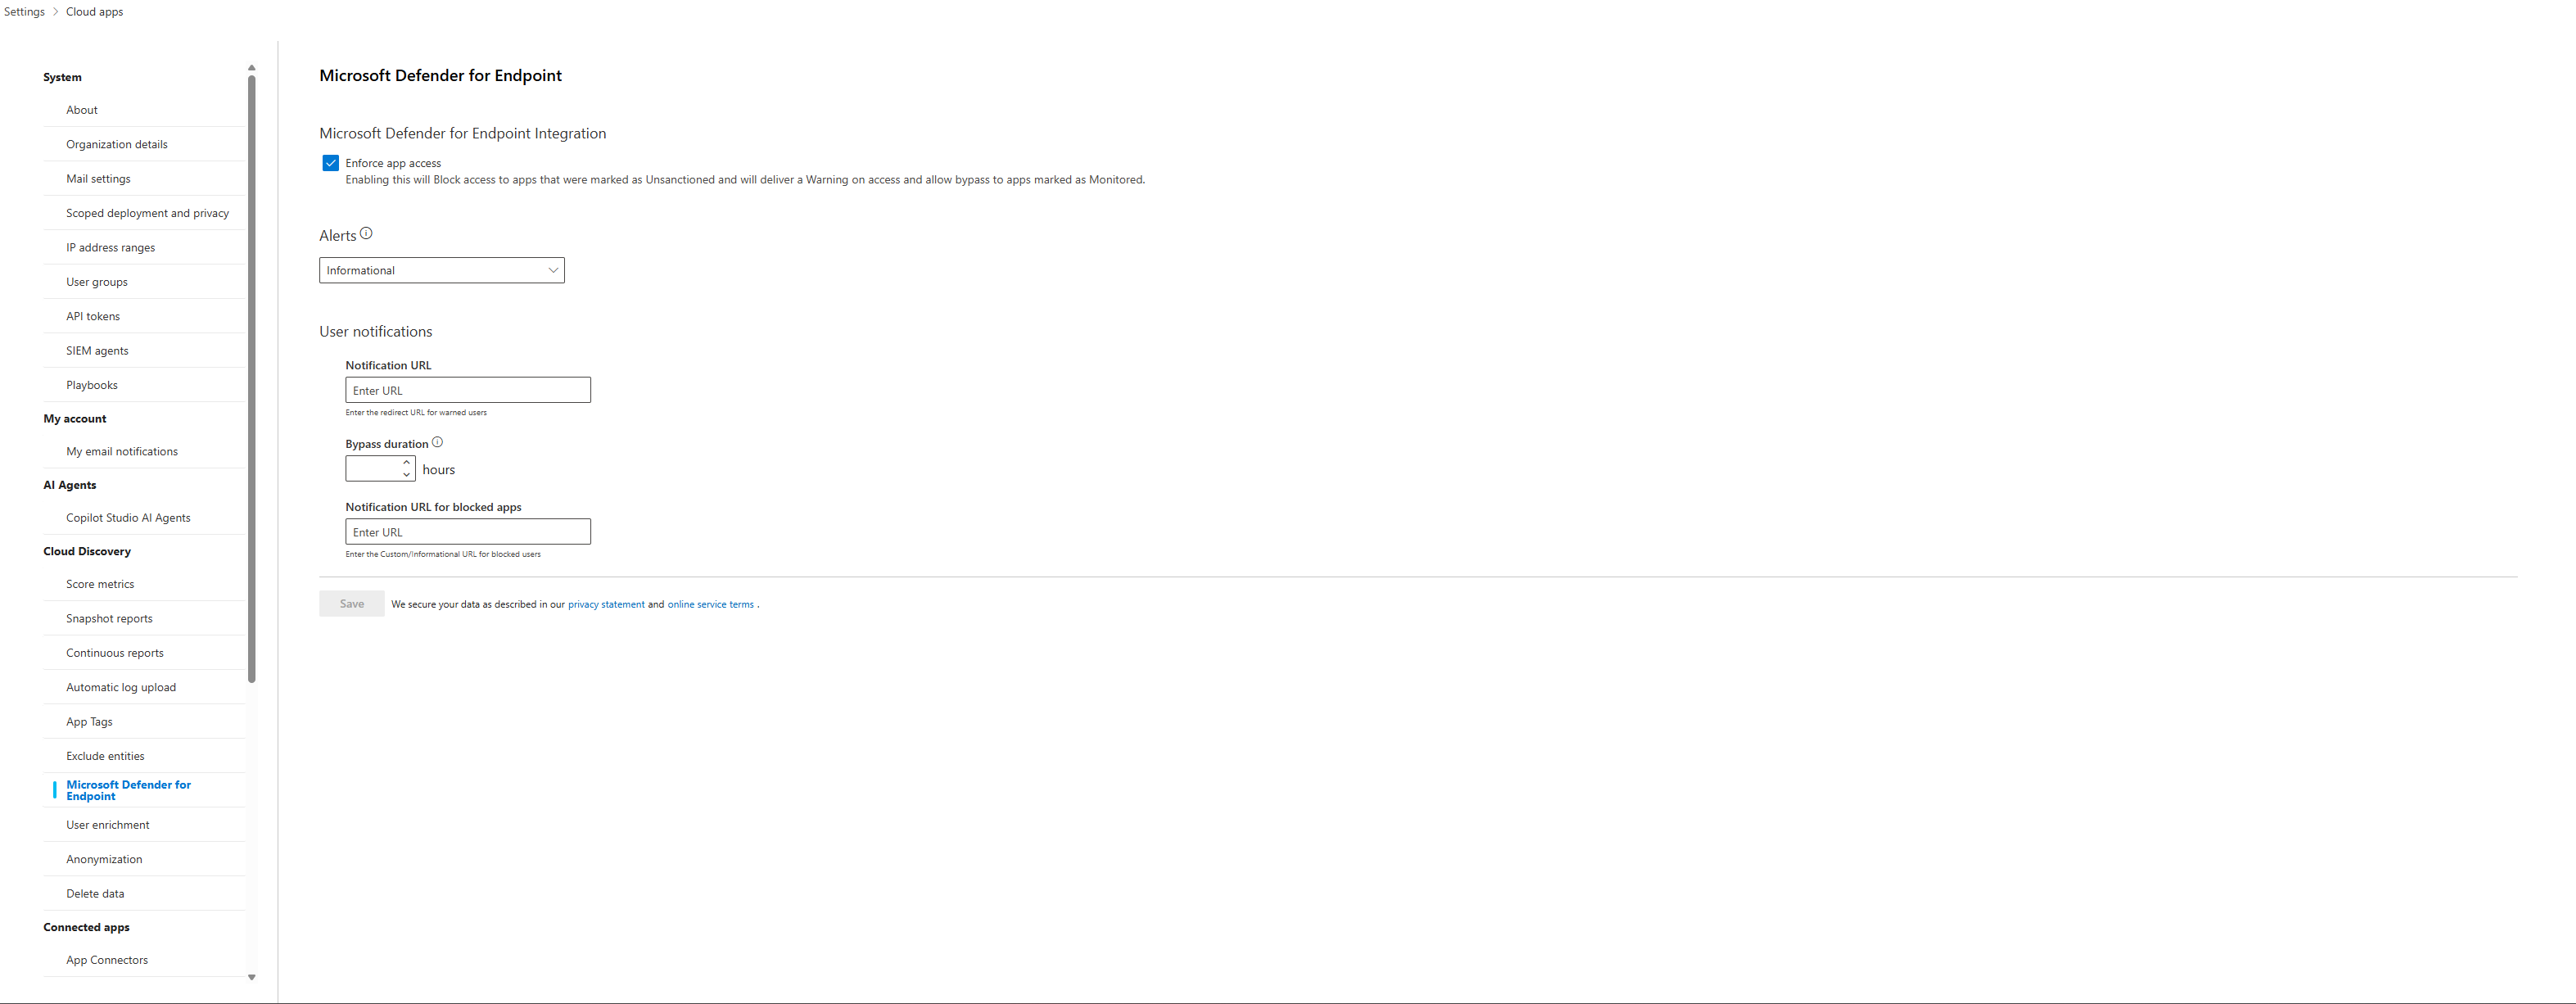
Remember to Enforce App Access in Cloud Apps Settings! This way, when the app is tagged as Unsanctioned, Defender will block it.
Dissecting an Application
When you click on any app in the Discovered Apps list, you're taken to its detailed profile page. This isn't just a collection of data; it's a full intelligence dossier.
First Stop: The Risk Score Breakdown
At the top, you'll see the overall risk score (out of 10), but the real gold is the breakdown across four categories. This tells you why an app is risky.
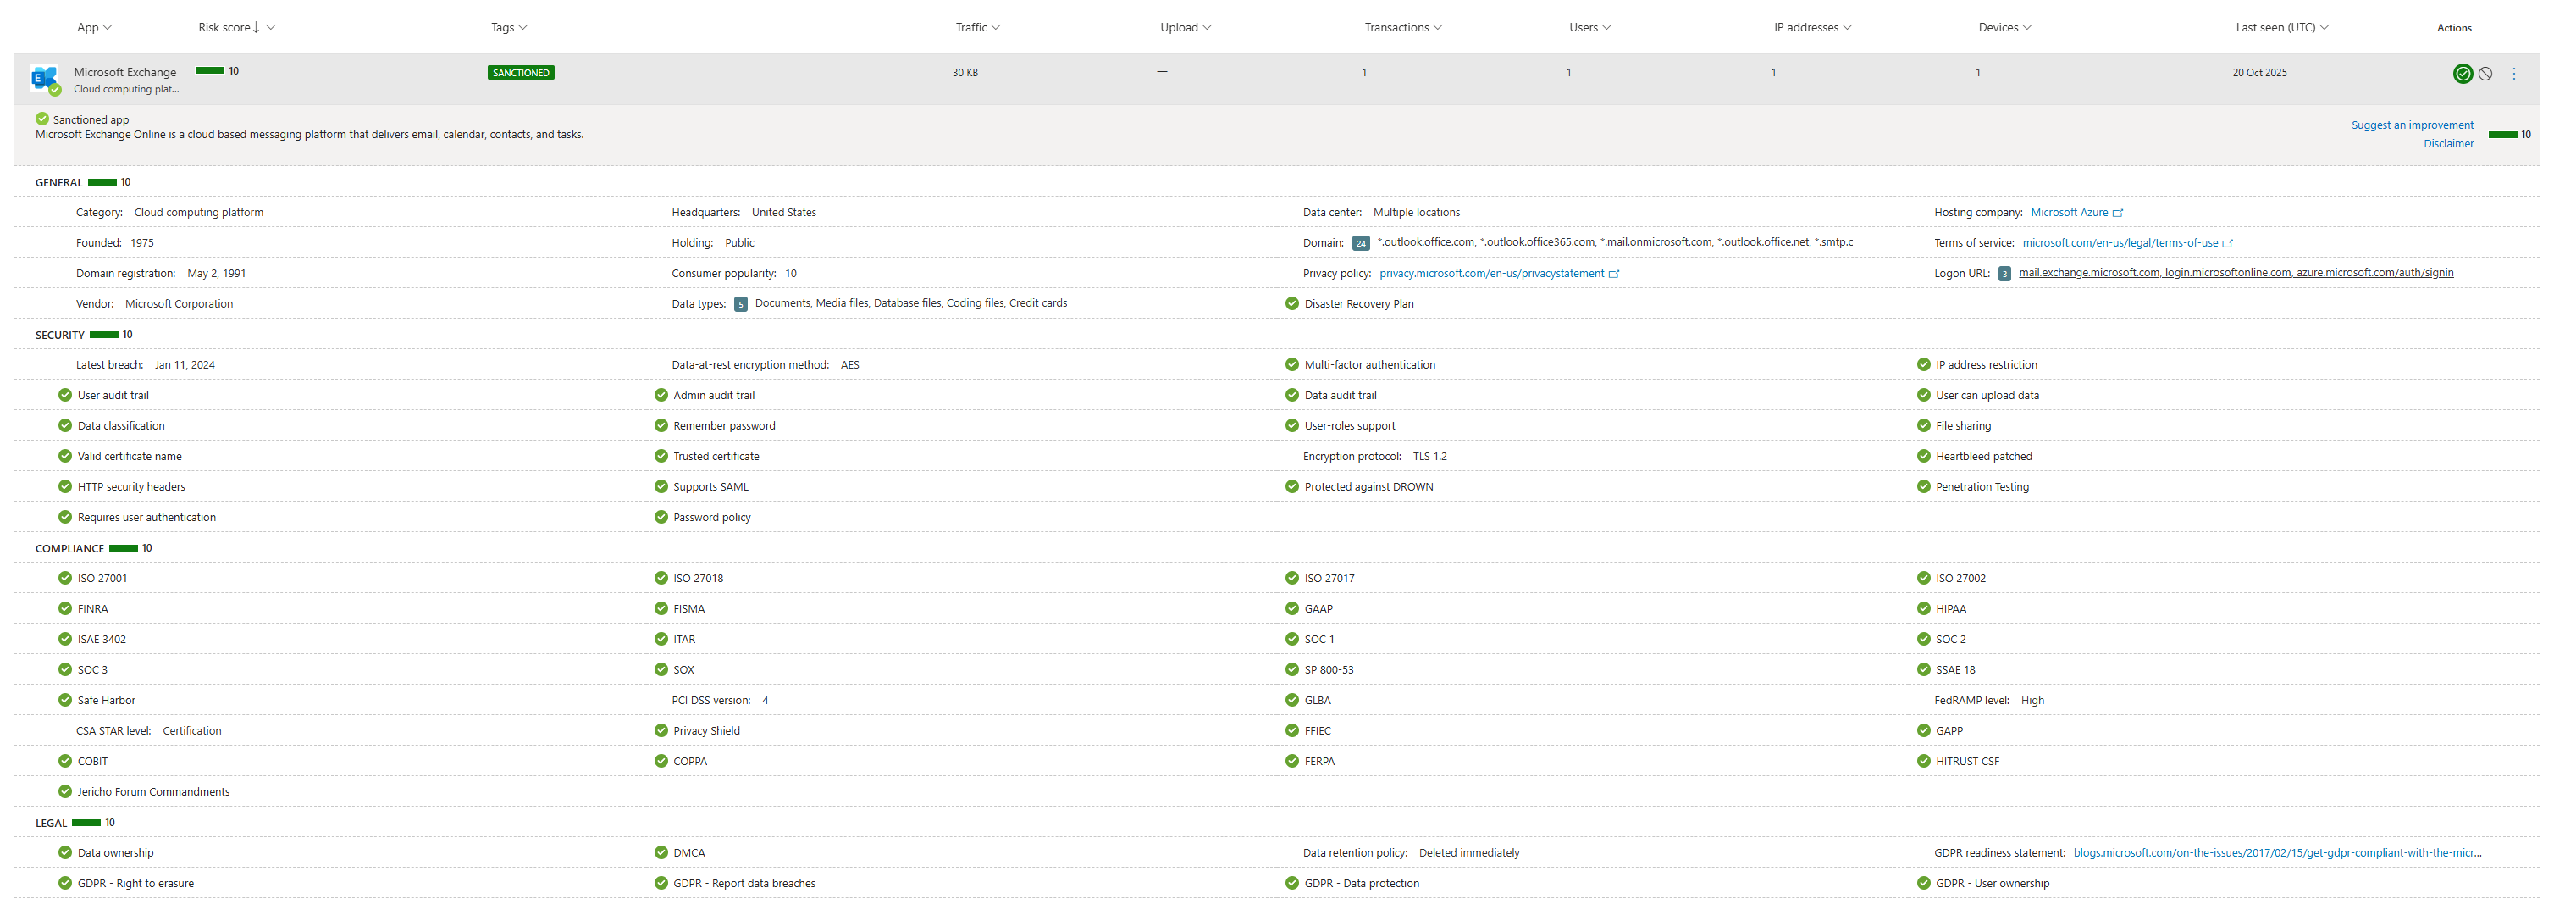
- General (Score: 10/10): This is about the company itself. Is it a popular, established vendor like Microsoft, or a brand-new domain registered last week? A low score here means the company is an unknown quantity.
- Security (Score: 10/10): This is the technical stuff. Does the app support MFA? Is data encrypted at rest? Has it been patched for Heartbleed? A low score here means weak technical security controls.
- Compliance (Score: 10/10): This is for your auditors. Is the app compliant with standards like ISO 27001, SOC 2, HIPAA, or GDPR? A low score means using it could put your company in legal jeopardy.
- Legal (Score: 10/10): This is the fine print. Who owns the data you upload? Do they have a data retention policy? A low score here could mean that, according to their terms of service, they own your confidential data the second you upload it.
As an analyst, you can now make an informed judgment. An app with a low Security score is a technical risk. An app with a low Legal score is a business risk. This context is everything when deciding whether to sanction or unsanction an app.
Pivoting Through the App's Profile Tabs
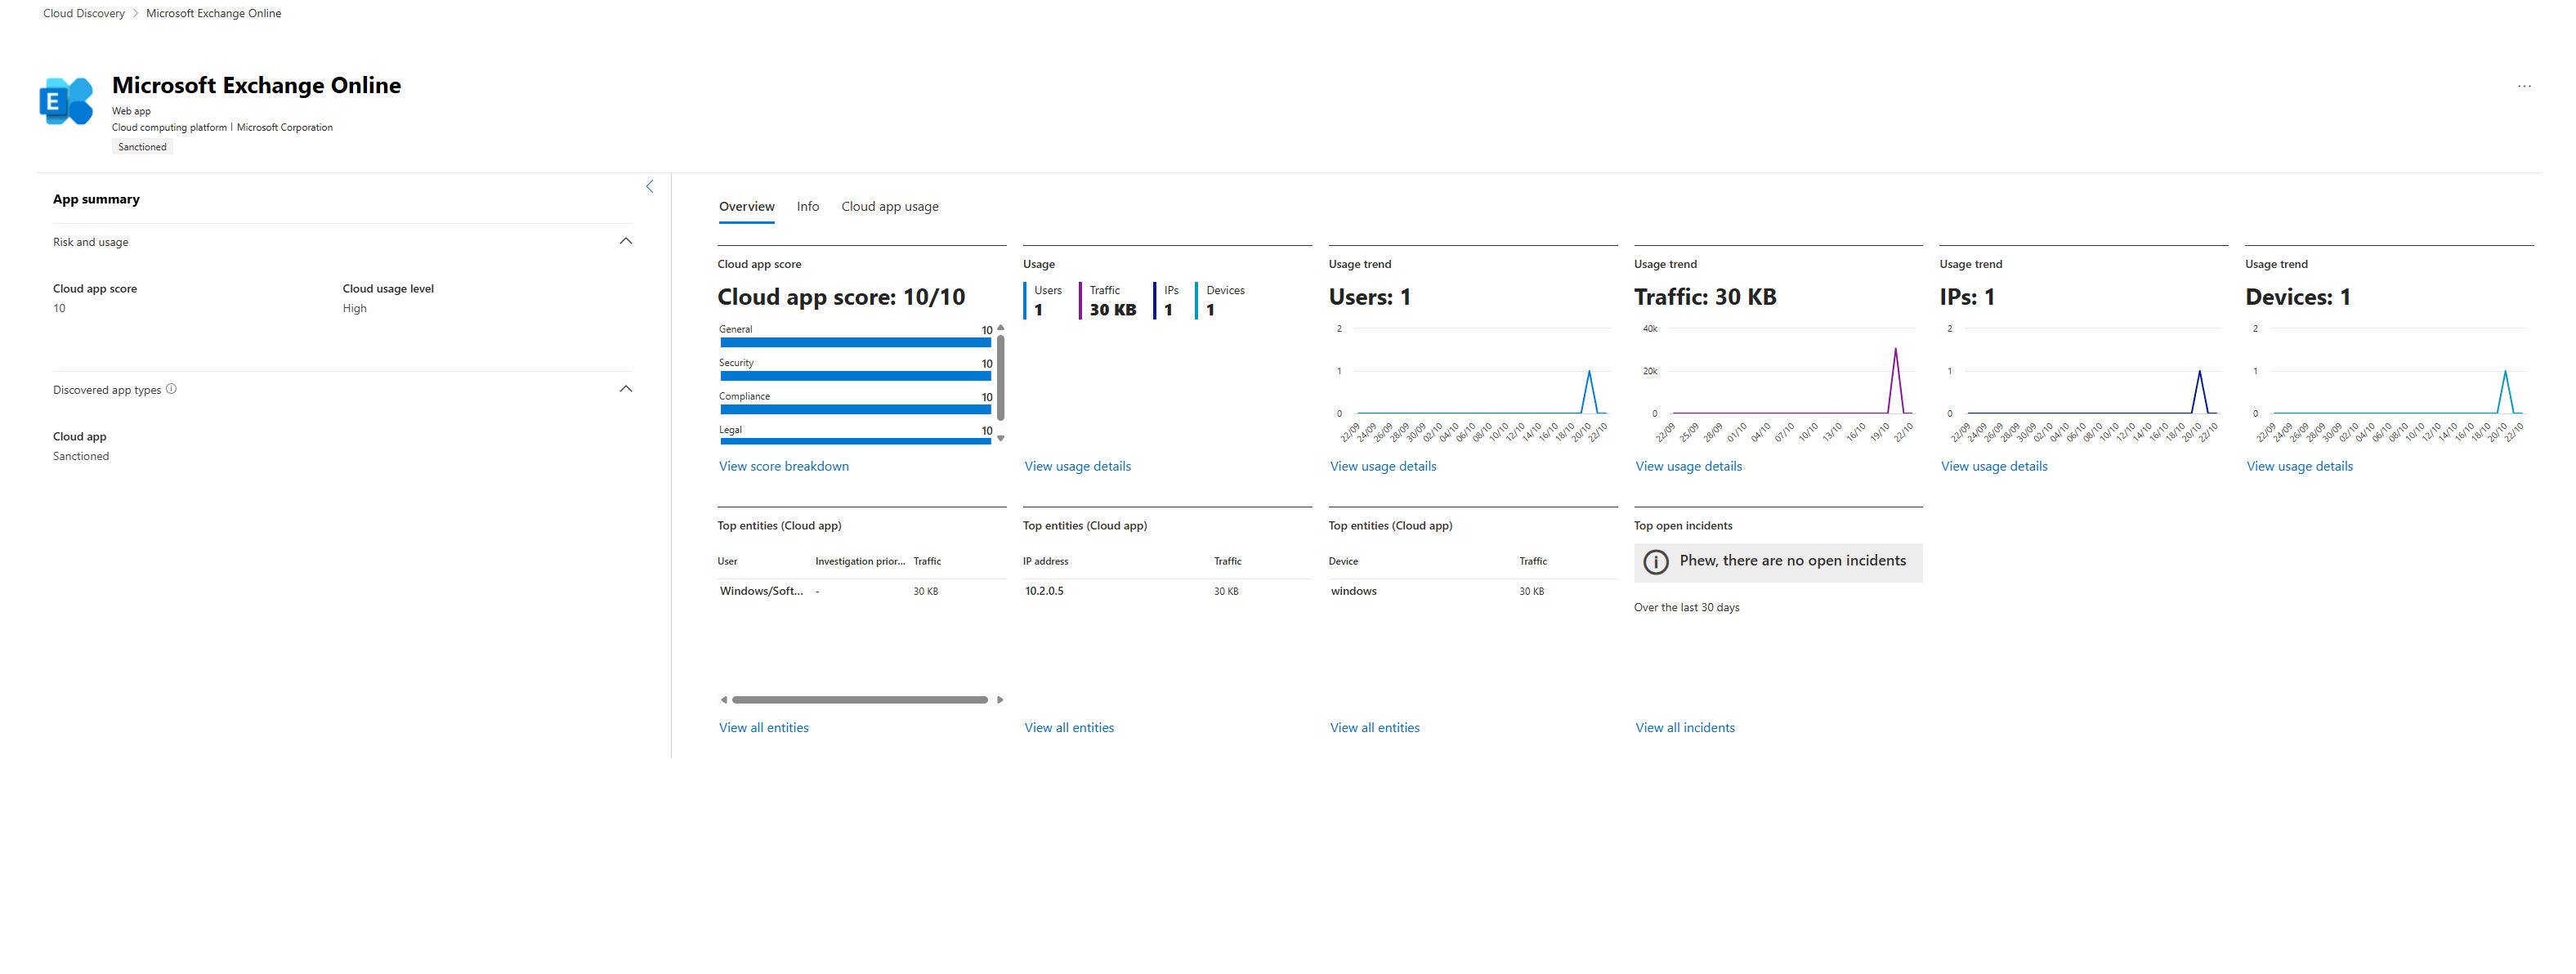
When clicking on the application, you are presented with a new set of information.
- Overview Tab: Think of this as the app's personal mini-dashboard. You get at-a-glance usage trends, traffic volume, and a list of the top users, IPs, and devices. If you see a sudden, massive spike in the "Usage trend" chart, that's an immediate red flag for investigation.
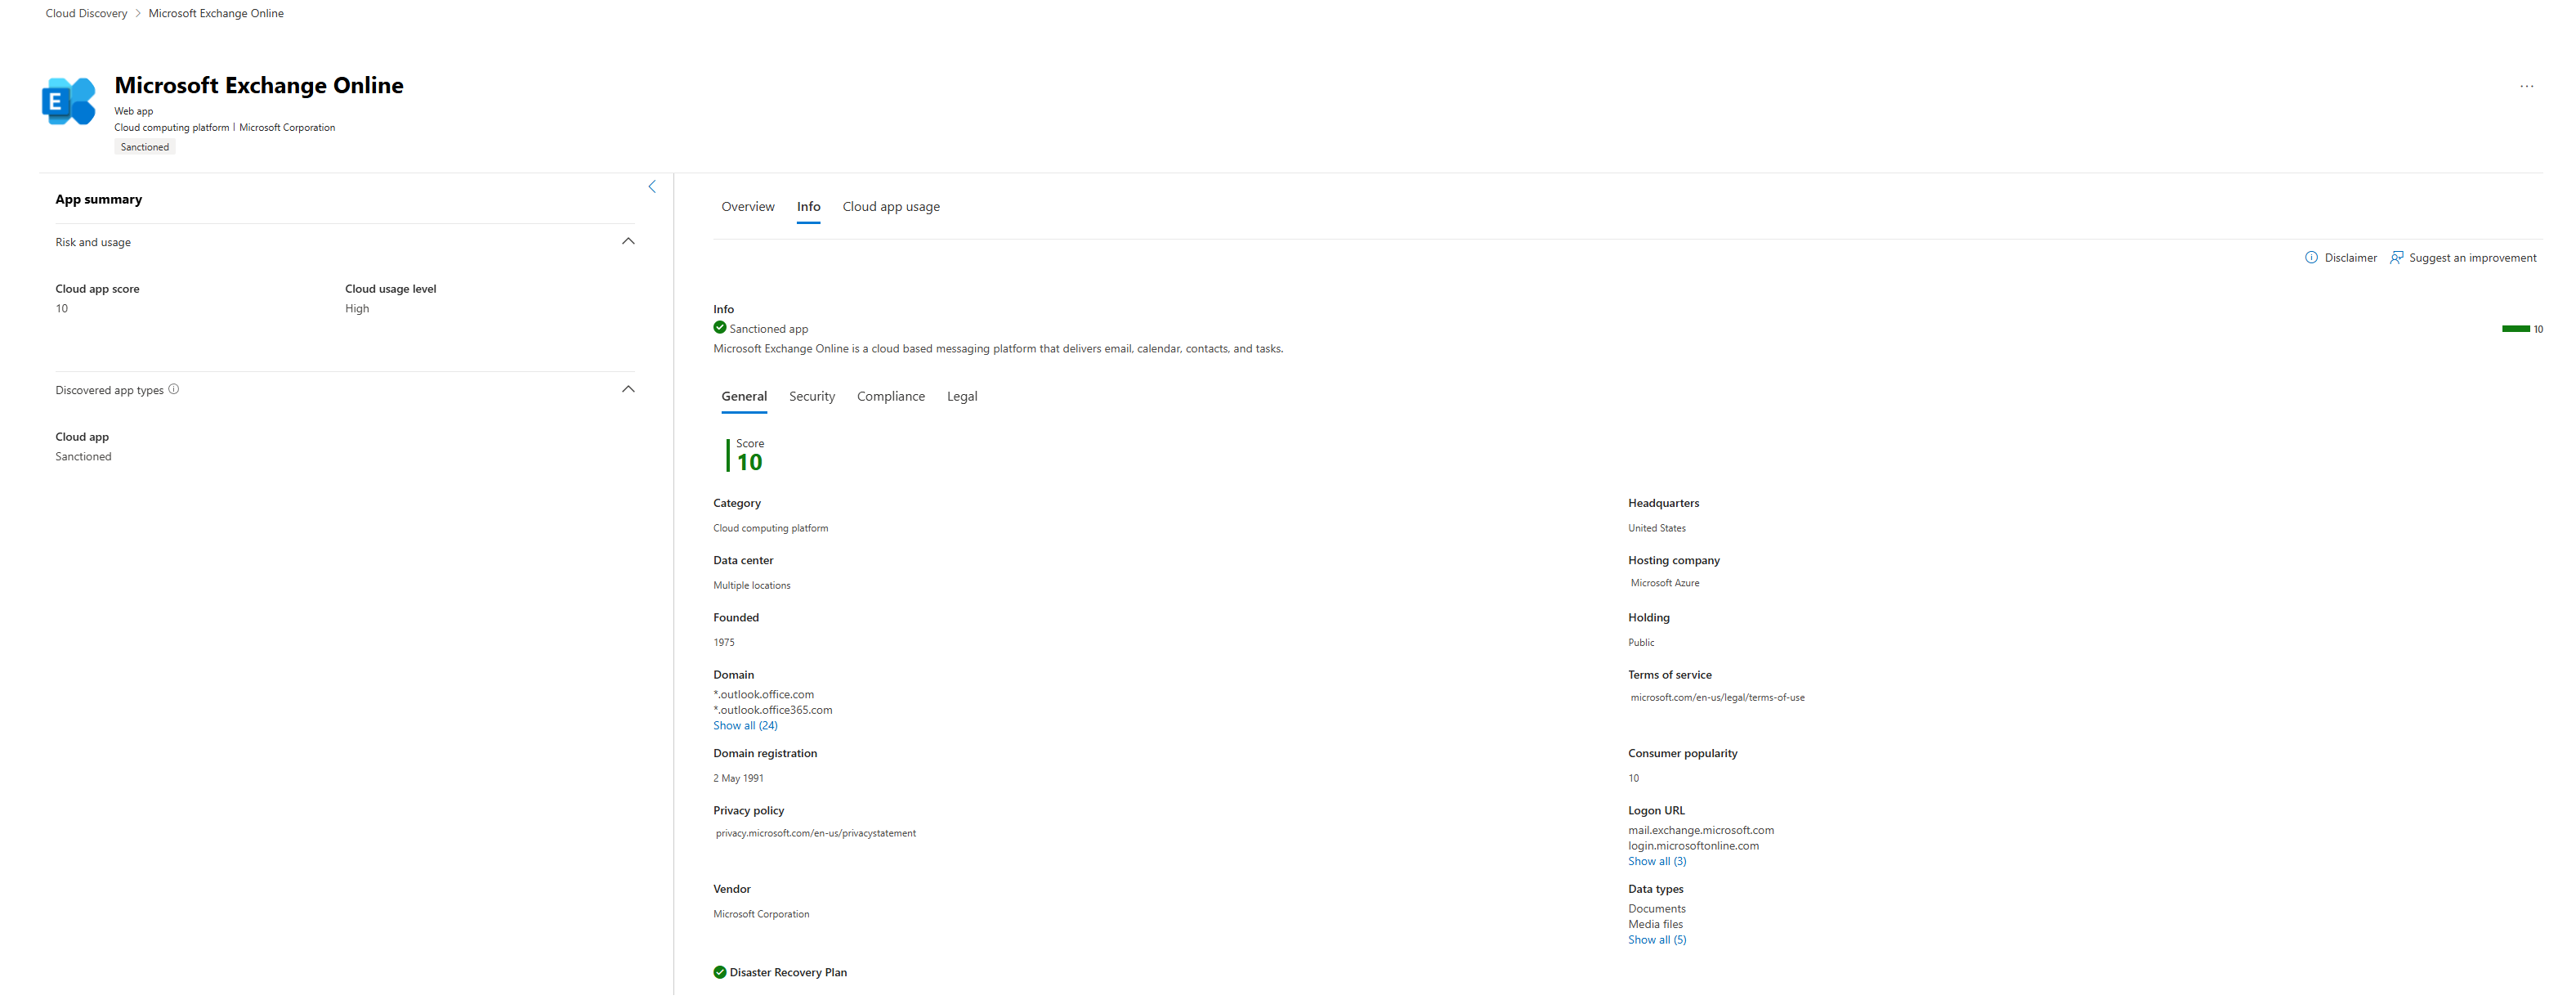
- Info Tab: This is the raw data behind the scores. It lists every domain associated with the app, links to its privacy policy, and details every single security and compliance factor.
- Cloud App Usage Tab: This is where you go from "what" to "who." It gives you a full, sortable list of every user, source IP, and device that has accessed this application. See a suspicious app? Click this tab, sort by "Traffic," and you'll instantly see who your top data contributors are. This is your primary pivot point for investigations.

The Reverse Pivot: Investigating a User
Just as you can pivot from an app to its users, you can also start your investigation from the user's perspective. Back on the main Cloud Discovery dashboard, instead of clicking the "Discovered apps" tab, click the "Users" tab.
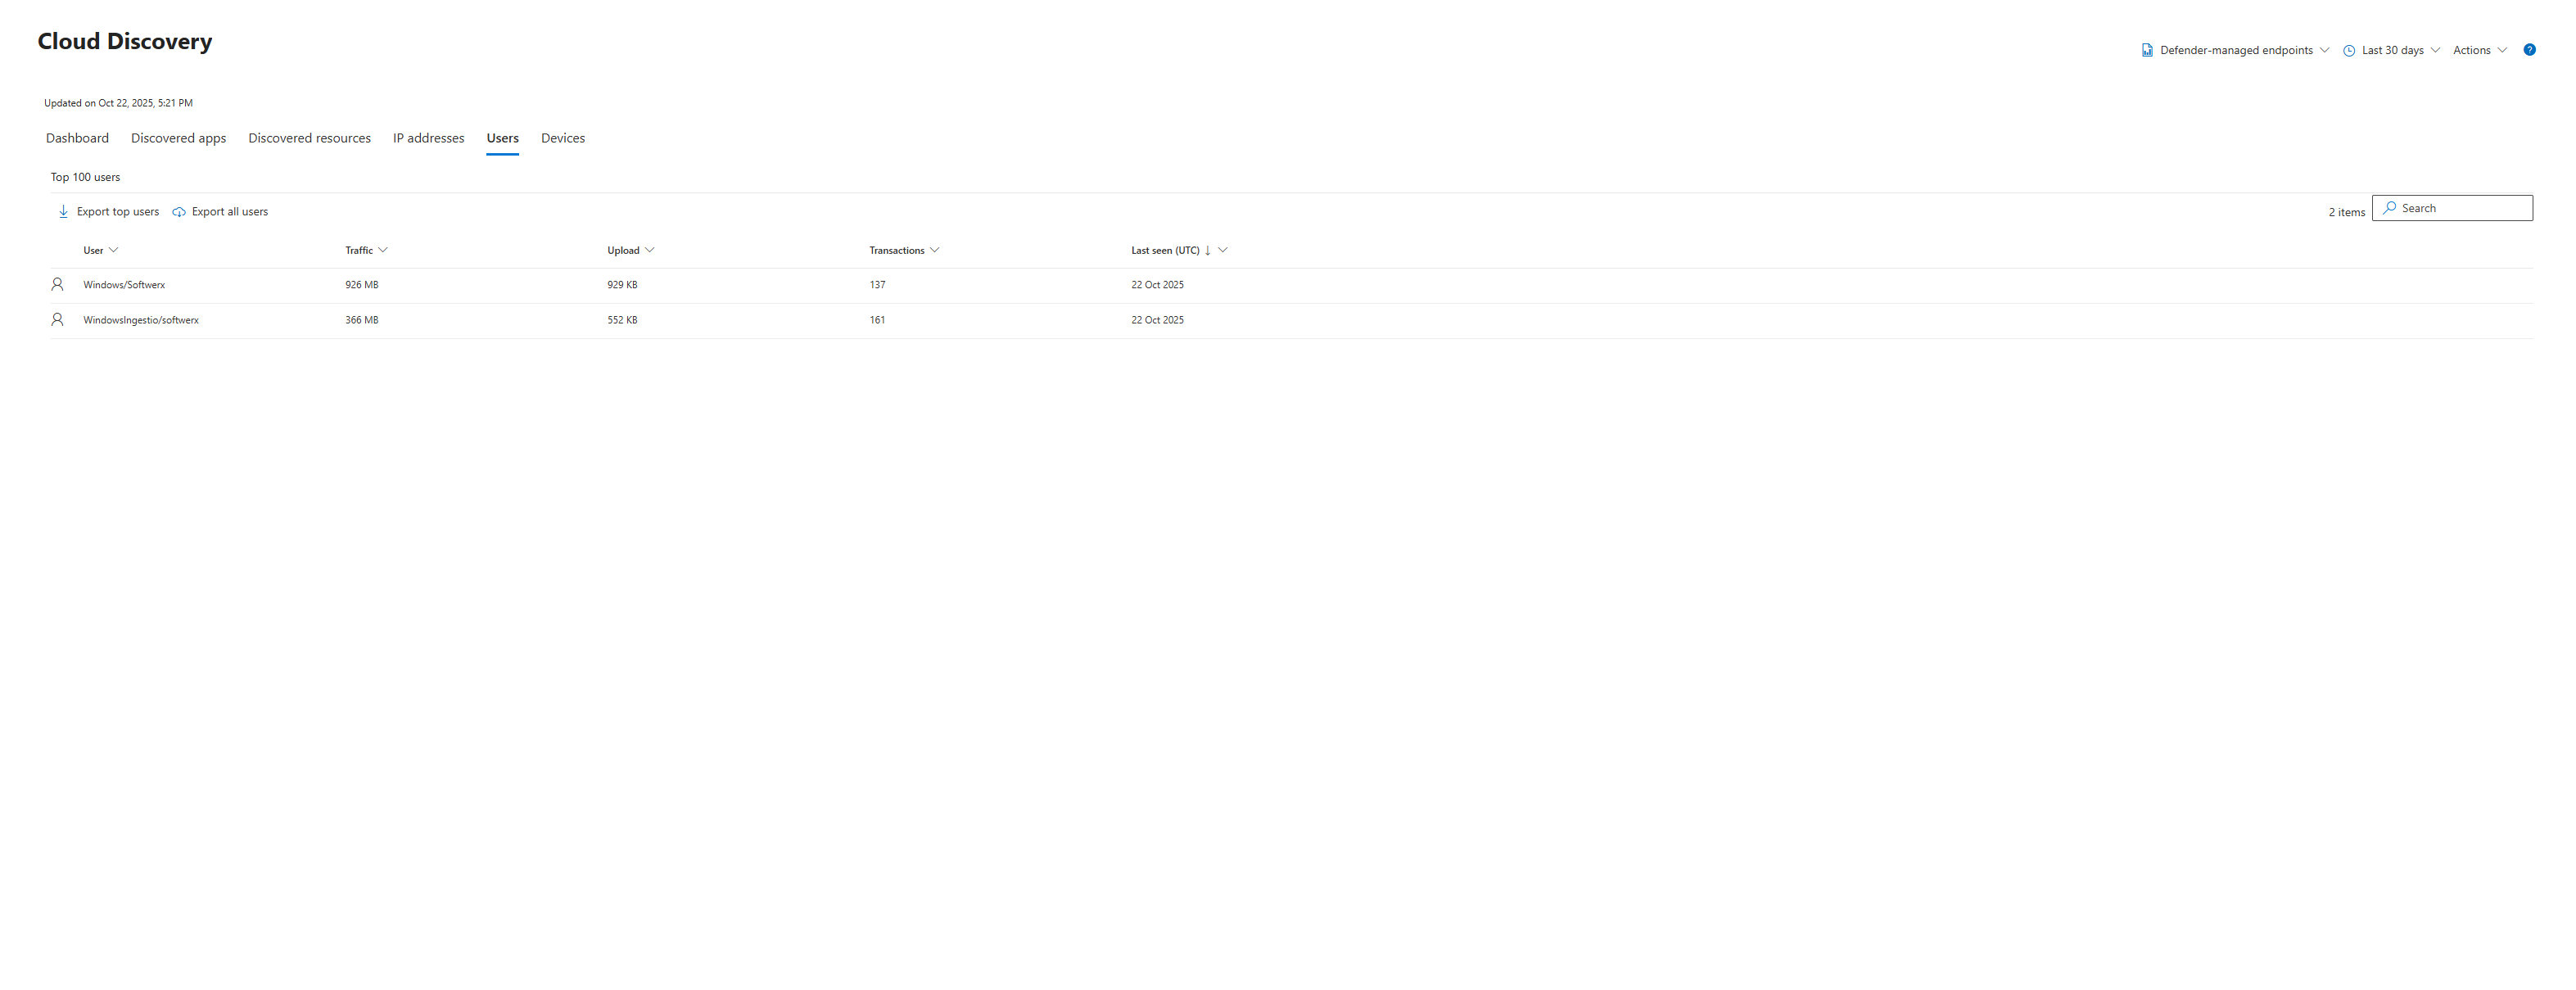
Here, you'll see a list of all users, ranked by their traffic, transactions, or the number of apps they've used. This is perfect for finding your "power users" or potential outliers.
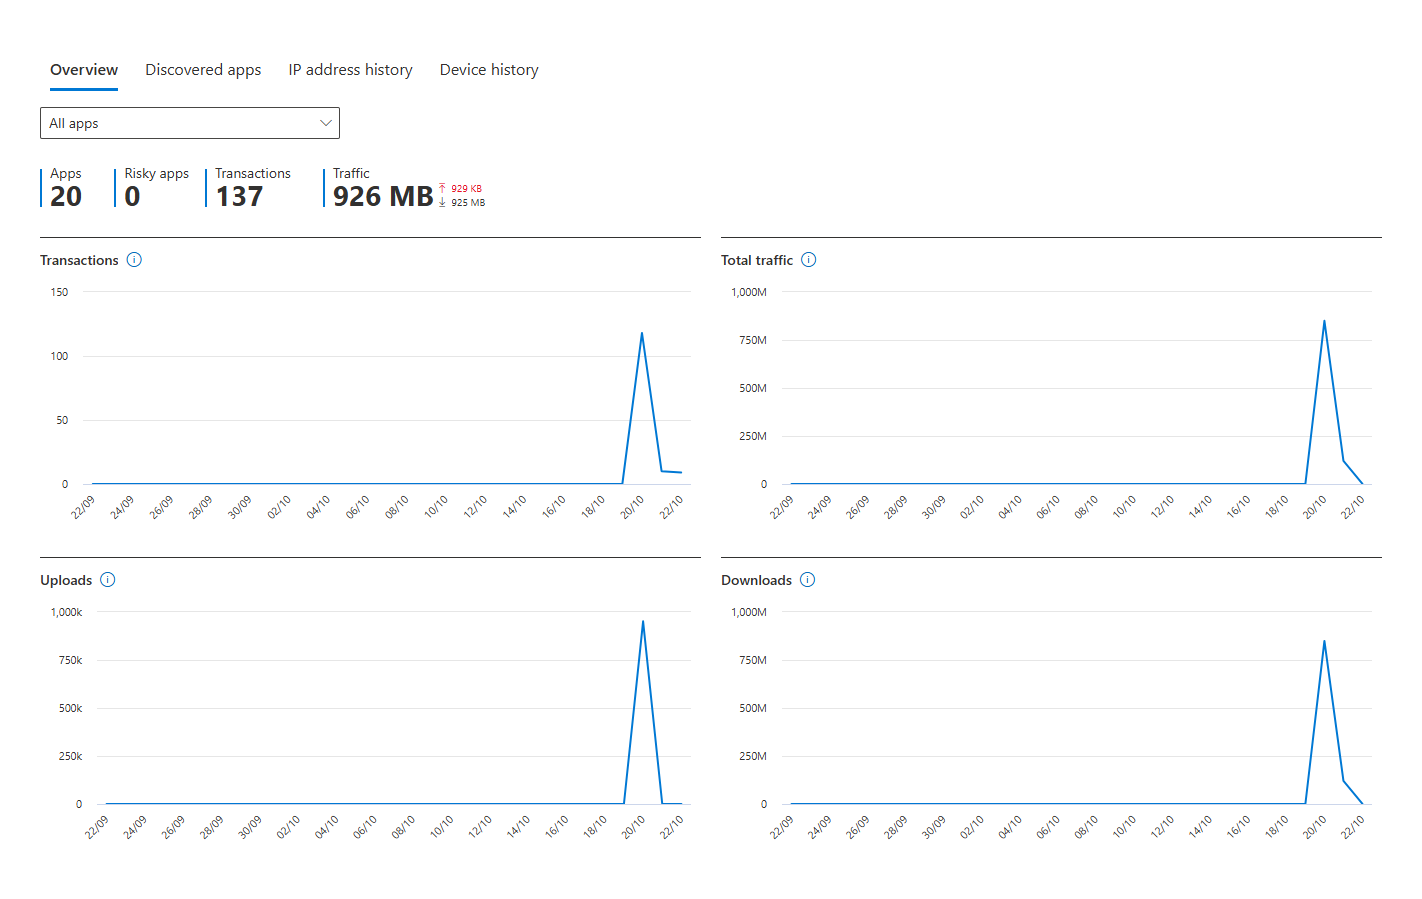
When you click on a specific user, you get another dedicated dashboard, this time centred entirely on them.
- User Overview: You get the same kind of mini-dashboard, showing this specific user's total traffic, transactions, and usage trends over time.
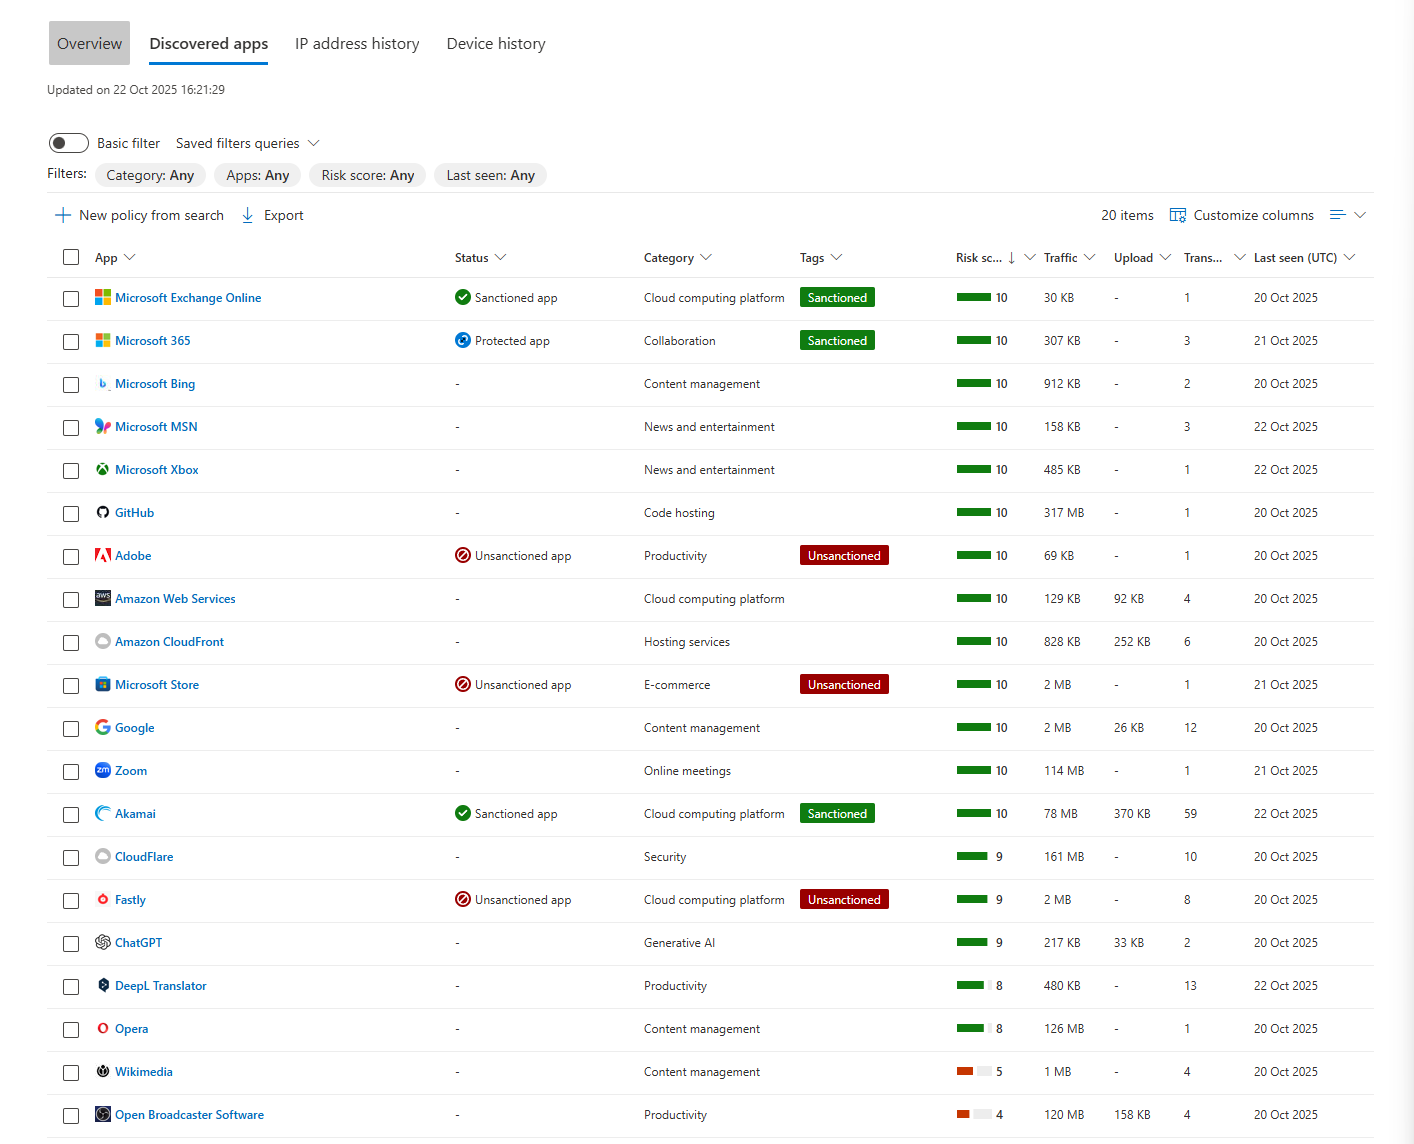
- Discovered Apps Tab: This is the user's personal app inventory. It's a filtered list showing every single cloud application this user has touched. It's their digital fingerprint. Is this person in Finance? Why are they using developer tools on AWS? This view makes those questions easy to ask.
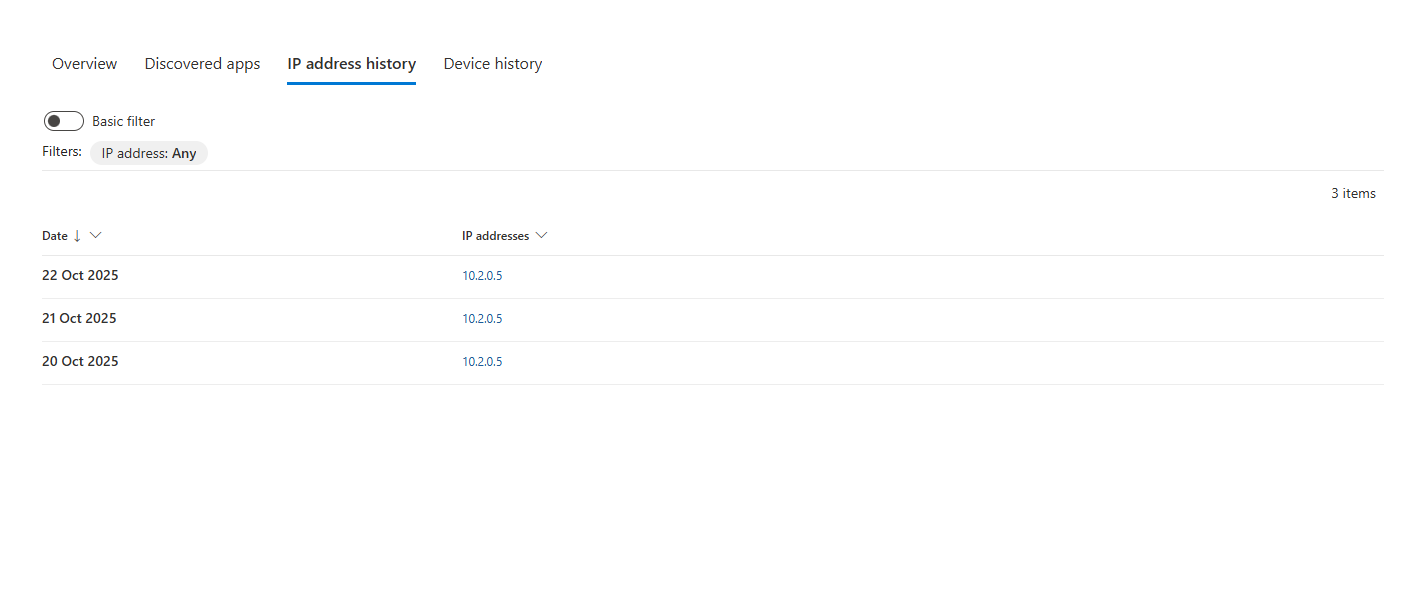
- IP Address History & Device History Tabs: These tabs provide a simple but powerful timeline. You can quickly see every IP address the user has come from and every device they have used. If you see a user who works exclusively in the UK suddenly showing IP addresses from three different continents in one day, you've likely found an impossible travel scenario and a compromised account.
By using these pivot points, you're no longer just looking at a list of apps. You're building a story. You're connecting users to apps, apps to data, and data to risk. This is the fundamental skill of a CASB operator.
Class dismissed.