Sentinel Cost Spike: How To Actually Find The Culprit Table

All right class.
Your CFO walks over and asks why the Azure bill just went up and why “Microsoft Sentinel” is suddenly the top line item.
You open the Cost page, see “Log Analytics / Sentinel” spiking, and you stare at it like it’s going to explain itself.
You may stare at the total cost and never actually prove which table went crazy, which resource caused it, and exactly when it started.
Let’s fix that.
Step 1 - Prove which table exploded
You don’t start in Sentinel incidents. You start in the Usage table.
Usage is the billing telemetry for your workspace. It tells you, per hour, per table:
DataType– the table name (AzureDiagnostics, SecurityEvent, DeviceEvents, etc)Quantity– data volume in MBIsBillable– whether you’re actually charged for it
That KQL you pasted is exactly what you want for “what the hell just happened in the last day”:
// Visualise table volume over time to spot spikes
let lookback = 24h;
let binSize = 1h;
Usage
| where IsBillable == true
| where TimeGenerated > ago(lookback)
| summarize GB = round(todouble(sum(Quantity)) / 1024.0, 3)
          by bin(TimeGenerated, binSize), DataType
// Optional: focus on top N talkers in this period
| summarize TotalGB = sum(GB) by DataType
| top 10 by TotalGB
| join kind=inner (
    Usage
    | where IsBillable == true
    | where TimeGenerated > ago(lookback)
    | summarize GB = round(todouble(sum(Quantity)) / 1024.0, 3)
              by bin(TimeGenerated, binSize), DataType
) on DataType
| project TimeGenerated, DataType, GB
| order by TimeGenerated asc
| render columnchart 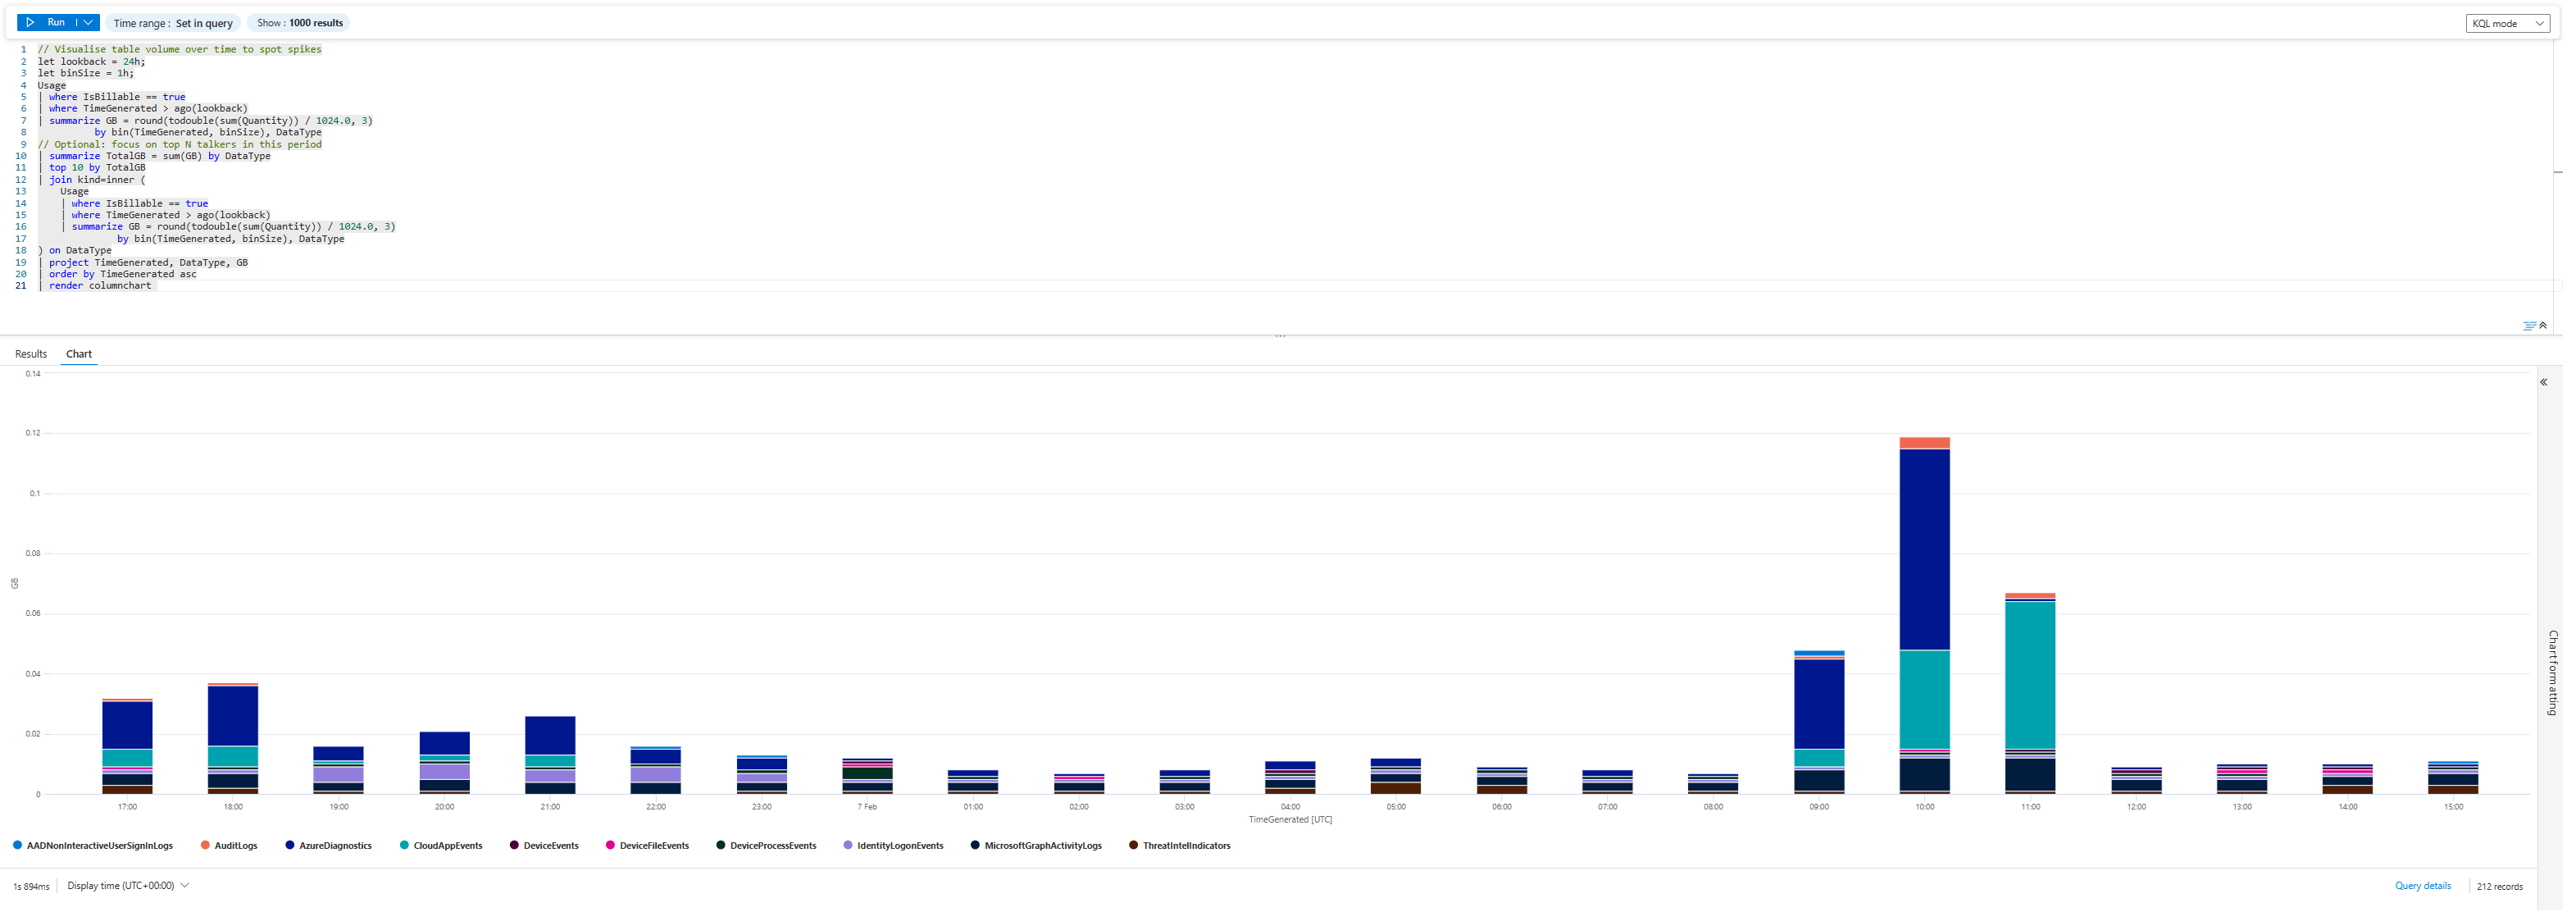
Run that for 24h, then 48h, then 7 days.
That tells you:
- The problem is not Sentinel as a whole
- The problem is one table:
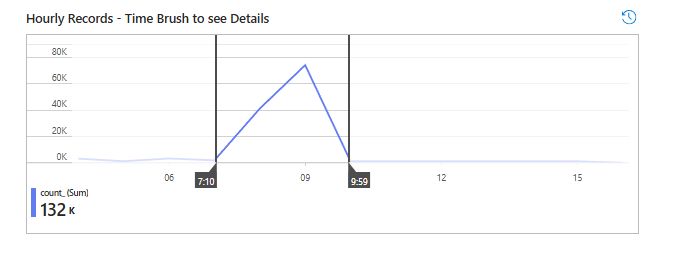
AzureDiagnostics(well, we can argue that Cloud App Events table also spiked, but let's focus on one table for now) - The spike started around 09:00–10:00 UTC on 07/02/2026
You’ve just answered the CFO’s first question: “What changed?”
Answer: AzureDiagnostics started vomiting data in that window.
Step 2 - Use Workspace Usage Report to sanity-check the crime scene
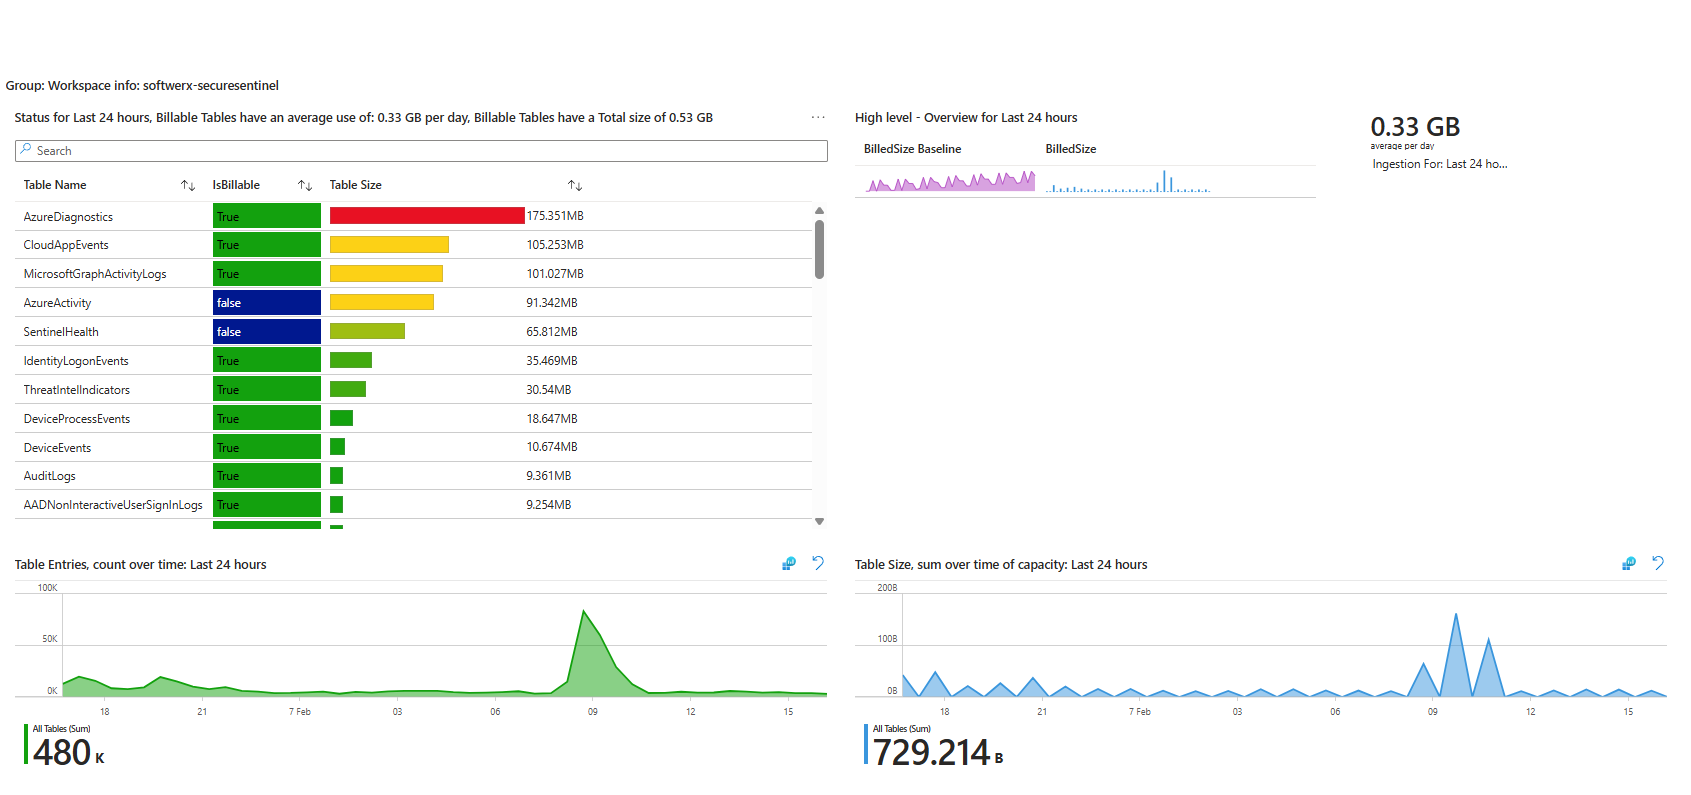
If you have the Workspace Usage Report workbook (you should, if you read your own blog), open it.
Here you can see:
- Top table by size: AzureDiagnostics
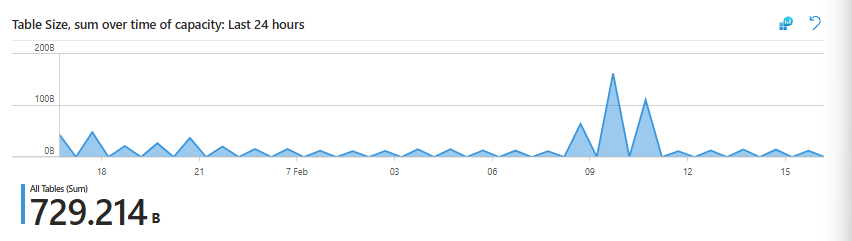
- Total volume over the last Time Range
- A spike in “Table size over time” that lines up with your Usage chart
This workbook is great for non-KQL people and for a fast gut check.
What it won’t do for you:
- It won’t tell you which resource inside AzureDiagnostics is noisy
- It won’t tell you which operation or category is responsible
So you use it to confirm “Yes, AzureDiagnostics is doing something shady here,” then you drop to KQL
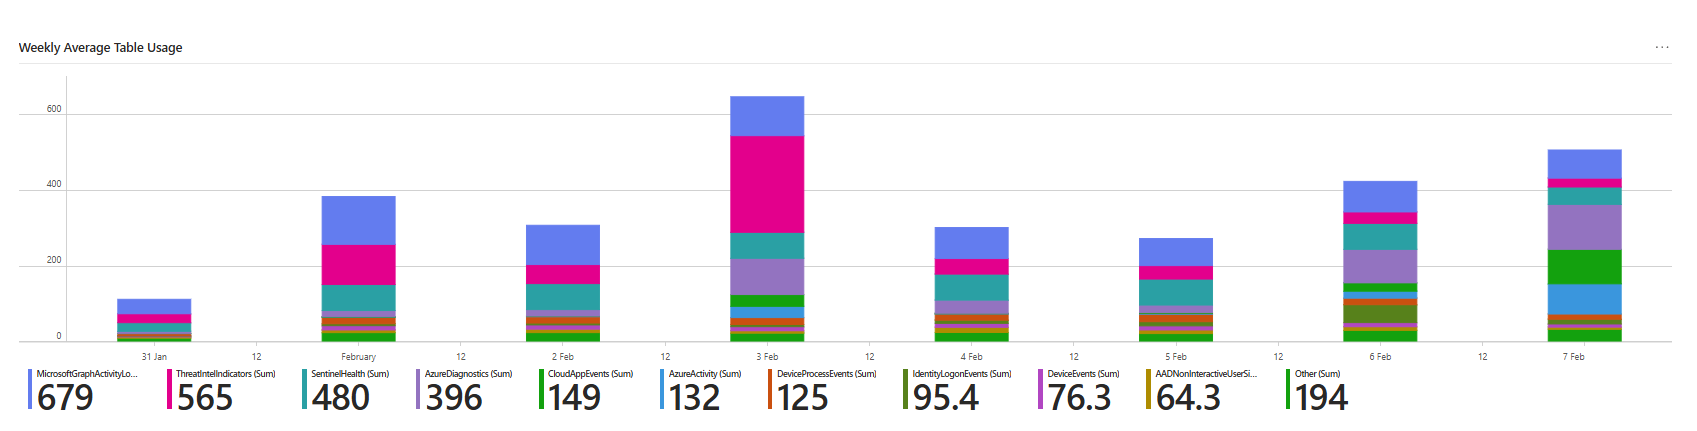
Check the purple part of the bar; each stack is generated daily, and you can clearly see the difference between the 5th of February vs the 7th
Step 3 - Prove which resource inside AzureDiagnostics is guilty
Now you’re looking at AzureDiagnostics itself.
Start with the simple KQL; this is usually the part that may take a little longer, depending on the table. You can (and should) play around with it. The summarize is your great friend here
AzureDiagnostics
| where TimeGenerated >= ago(24h)
| summarize count() by Resource, ResourceGroup, ResourceProvider
| top 10 by count_
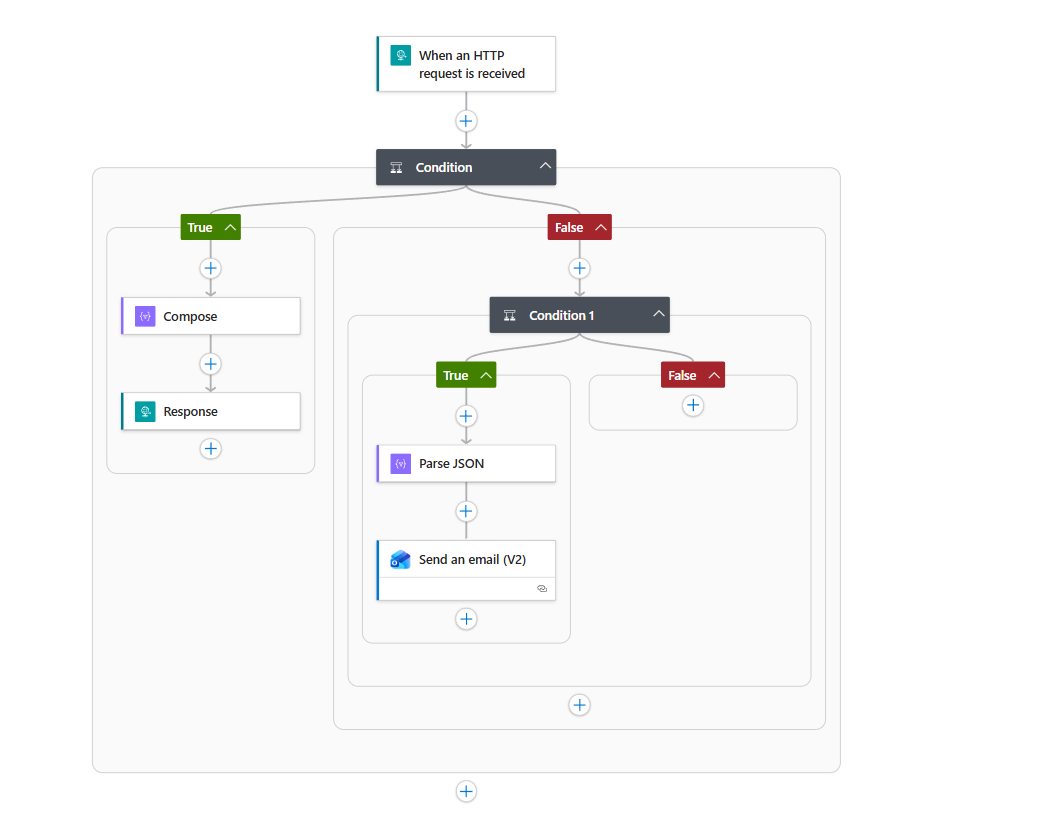
| sort by count_ descBased on the KQL results we have, ResourceGroup = SIMONTEST, ResourceProvider = MICROSOFT.LOGICand resources like:
CONDITIONCOMPOSERESPONSECONDITION_1SEND_AN_EMAIL_(V2)WHEN_AN_HTTP_REQUEST_IS_RECEIVED
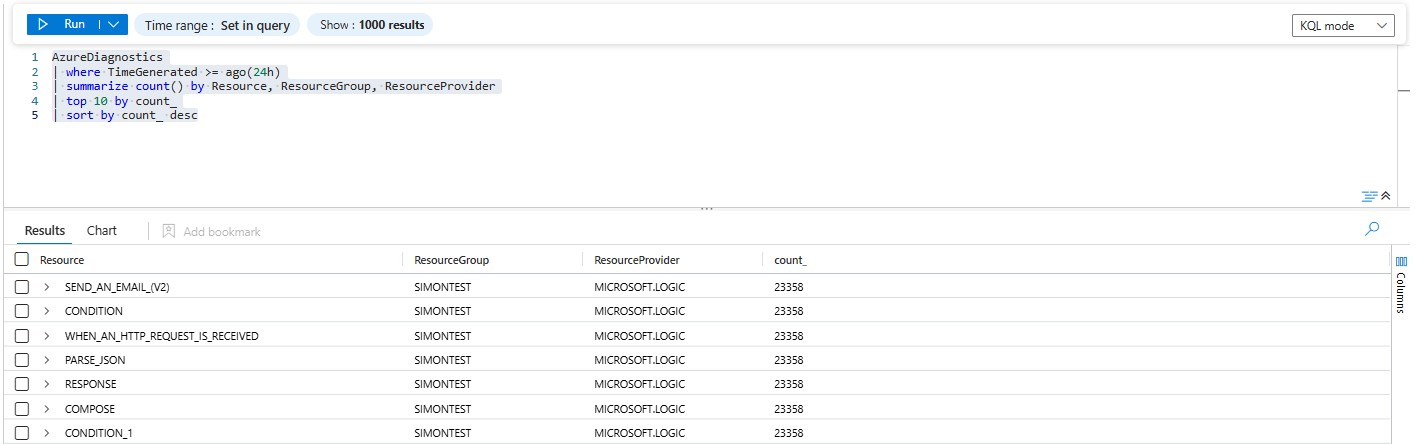
Those aren’t random VM names. That’s Logic App action names.
So now we know:
- Table:
AzureDiagnostics - ResourceProvider:
MICROSOFT.LOGIC - Culprit: a Logic App in
SIMONTESTthat logs every trigger and action
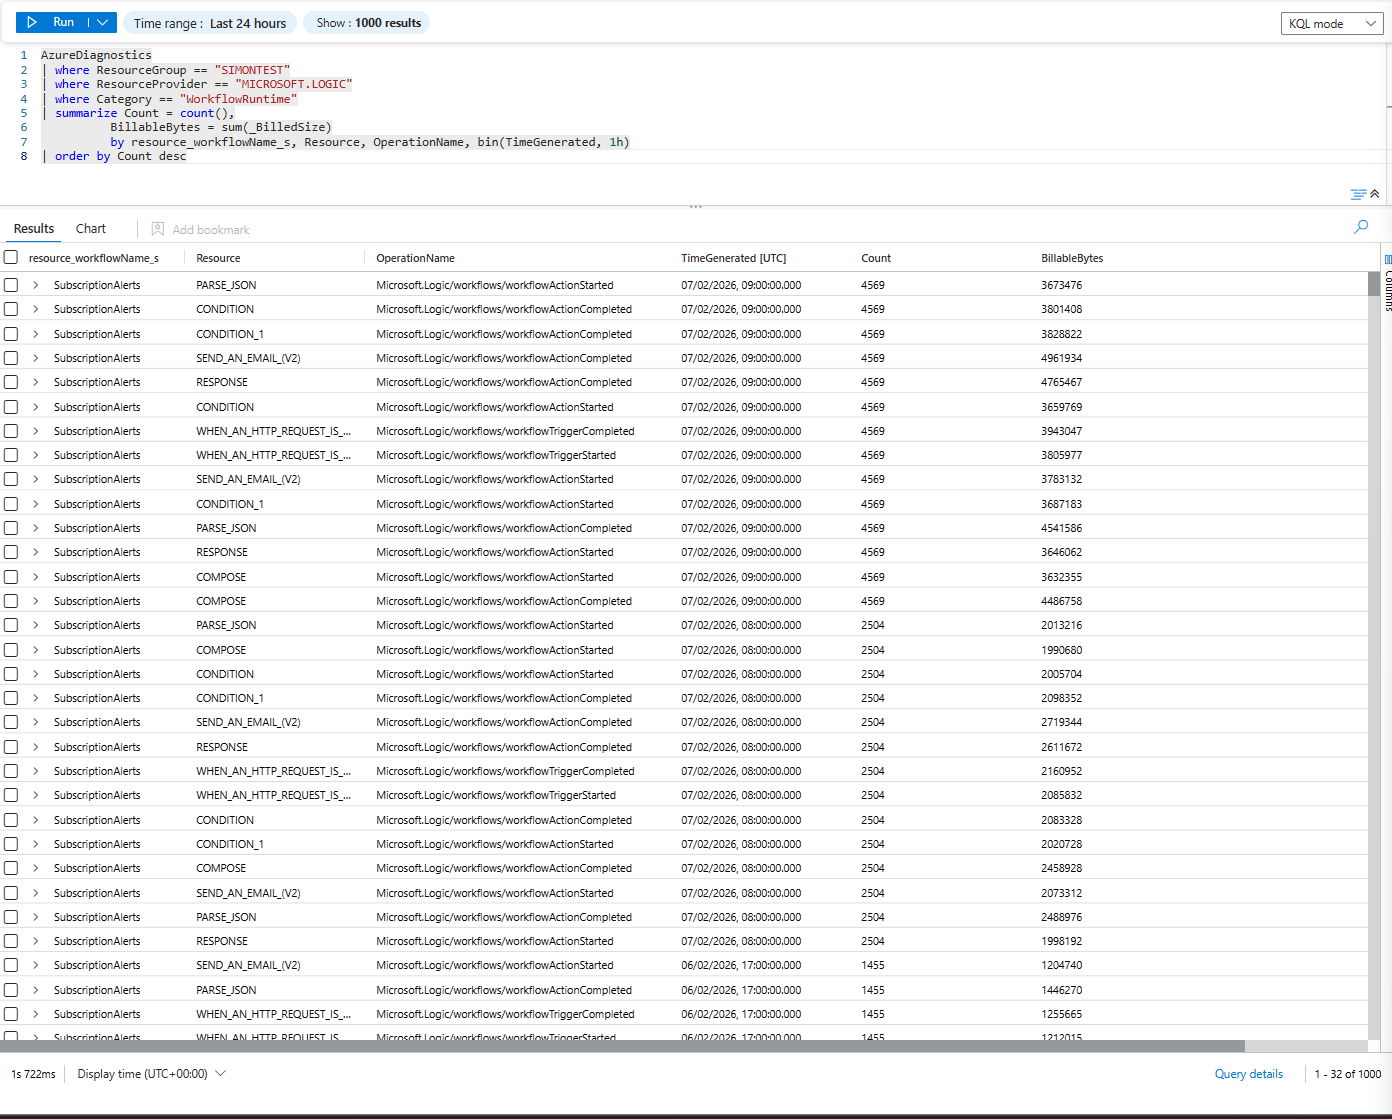
Let’s tighten it up:
AzureDiagnostics
| where ResourceGroup == "SIMONTEST"
| where ResourceProvider == "MICROSOFT.LOGIC"
| where Category == "WorkflowRuntime"
| summarize Count = count(),
          BillableBytes = sum(_BilledSize)
          by resource_workflowName_s, Resource, OperationName, bin(TimeGenerated, 1h)
| order by Count desc
This gives you, per hour:
- Logic app name (
resource_workflowName_s, e.g.,SubscriptionAlerts) - Action/trigger name (
Resource) - Operation (
OperationName– run started, action completed, trigger completed) - Count + actual billed bytes
This is where the “oh shit” moment usually happens: you see tens of thousands of rows for a single Logic App in one hour.
Step 4 - If you hate KQL, Recon Tools will still out you
The Sentinel Workspace Recon Tools workbook is basically cheating if you don’t want to build queries from scratch.
Switch to:
- Table Explorer tab
- Pick
AzureDiagnosticsin “Table Picker” - In Column Picker, choose
Caller(play around with column pickers depending on the table you are investigating)
You can also use the time brush to see only information from the time when the spike was seen.
You’ll see exactly what previous KQL showed:
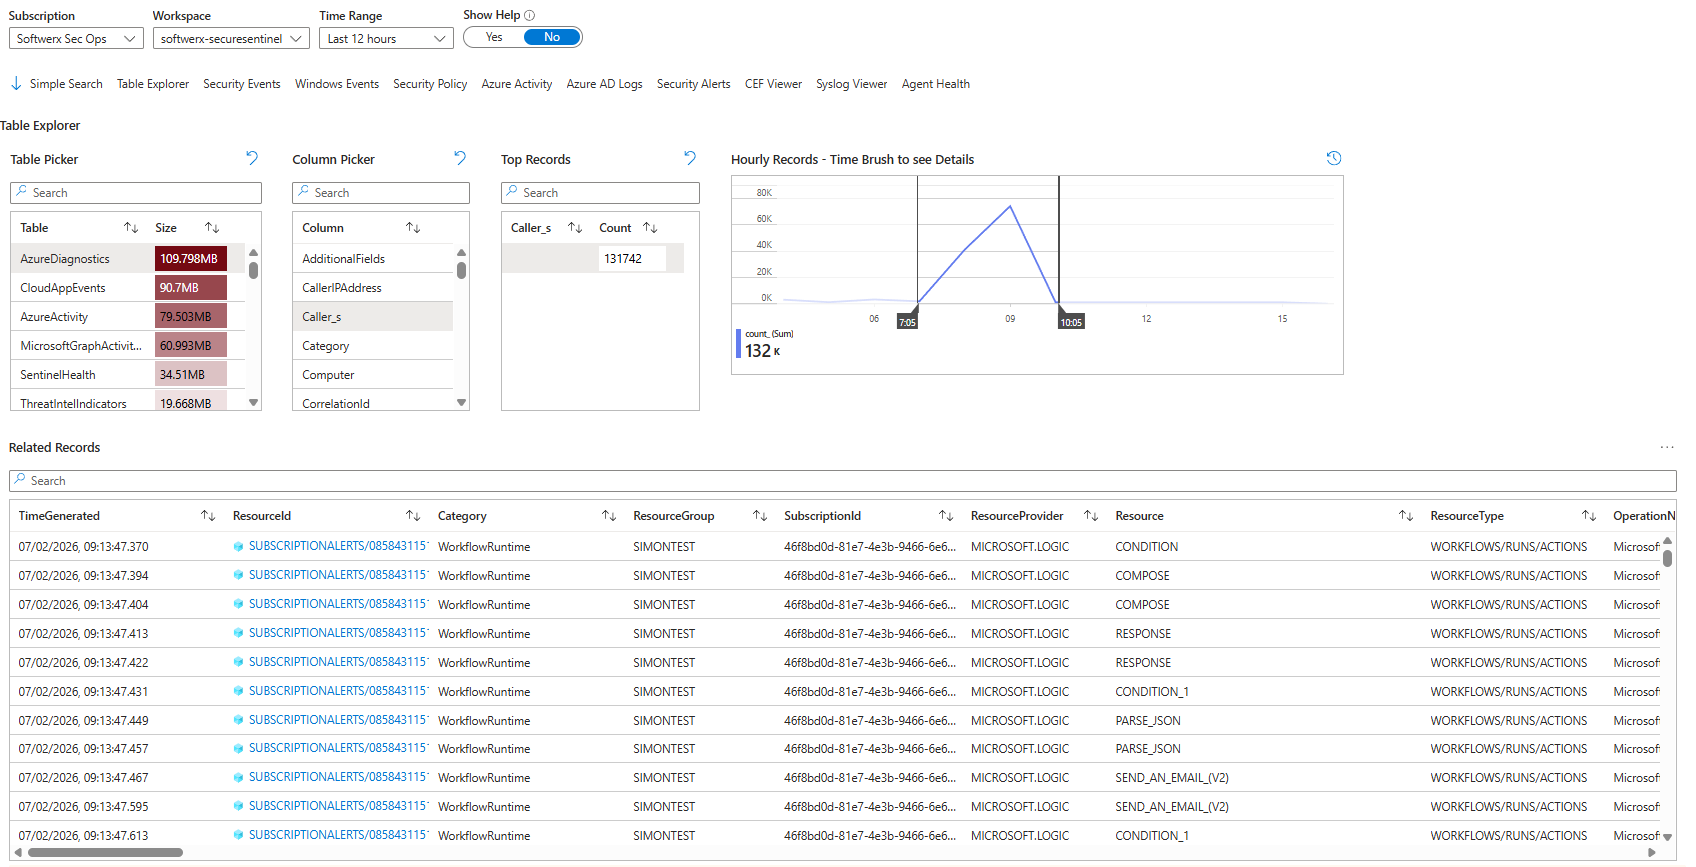
So even someone who “doesn’t do KQL” can point at the screen and say:
“The SubscriptionAlerts Logic App in SIMONTEST is generating AzureDiagnostics data.”
That’s all the evidence your manager actually wants.
Step 5 - Walk one record end-to-end
You’re looking at one aggregated row that already tells the whole story:
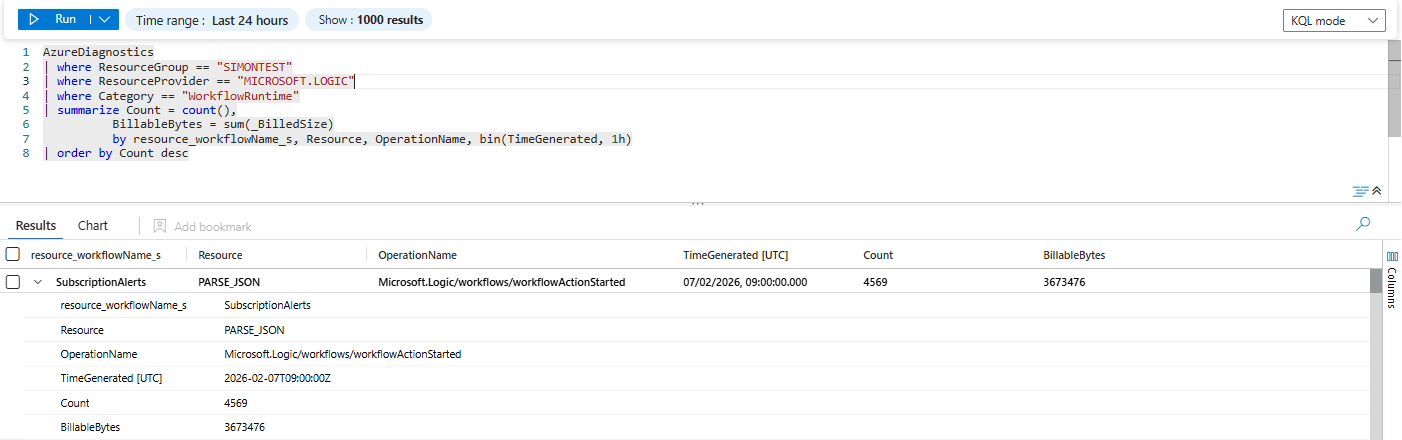
- Workflow:
SubscriptionAlerts(it's the name of the actual application) - Action:
PARSE_JSON - Operation:
Microsoft.Logic/workflows/workflowActionStarted - Time bucket:
2026-02-07T09:00:00Z(so 09:00–10:00 if you binned by 1h) - Executions:
Count = 4569 - Billed volume:
BillableBytes = 3,673,476
Translate that to something you can say out loud to a manager:
Between 09:00 and 10:00 UTC, the Logic App ran the PARSE_JSON action 4,569 times and generated about 3.5 MB of billable log data just for that one action.If your query was summing _BilledSize per hour, that BillableBytes is in bytes.
3,673,476 / 1,024 / 1,024 ≈ 3.5 MB for one action in one hour.
Now imagine:
- That’s just
workflowActionStartedforPARSE_JSON - You almost certainly also have:
workflowActionCompletedfor the same action- Trigger events (
workflowTriggerCompleted) - Possibly other actions (
CONDITION,COMPOSE,RESPONSE,SEND_AN_EMAIL_(V2))
So if one action is 3.5 MB/hour, the entire Logic App can easily be 100x more expensive, depending on how spammy the trigger and API calls are.
Step 6 - Don’t just find it, fix it
Finding the noisy table is the easy part. Stopping the money burn is where people either do something smart or absolutely wreck visibility.
Common mistakes I noticed people are making:
- They turn off all diagnostics for the resource “because cost”
- Or they disable Sentinel ingestion for the whole resource group
- Or they down-tune retention globally instead of touching the actual noisy signal
For Logic Apps -> AzureDiagnostics, you have better options:
Fix the Logic Application
Take a look at the actual Logic App (or ask the developer who created it) and see if there is anything that can be improved. Maybe it does not need to be running on the HTTP request received and could be moved to a weekly recurrence instead? Or maybe the whole application was created as a test, and someone just forgot to disable it? (it's more common than you think)
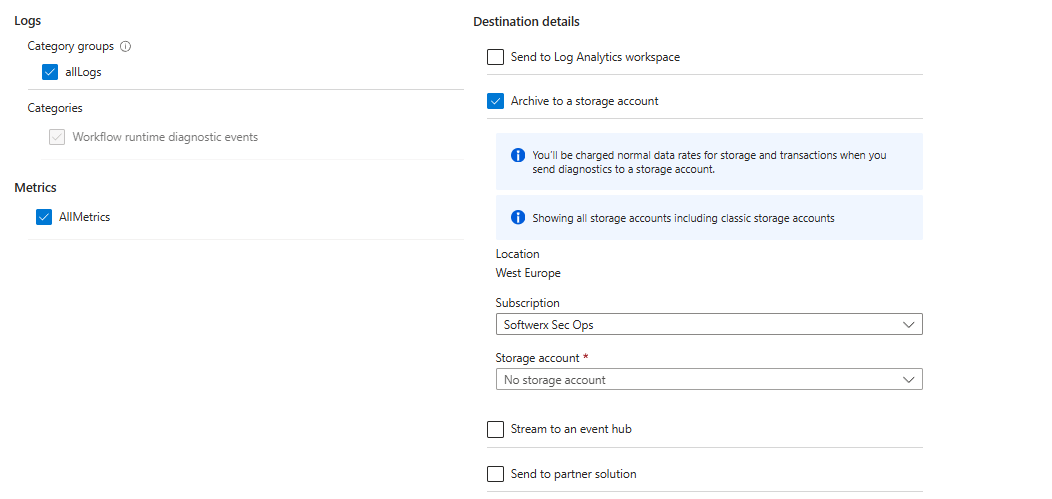
Change what you log
If you are using AzureDiagnostics route via the “Diagnostics settings” blade:
- Scope: the Logic App
- Destination: Log Analytics
Options:
- Log only Workflow runtime diagnostics event, cut
AllMetricsunless you specifically need them
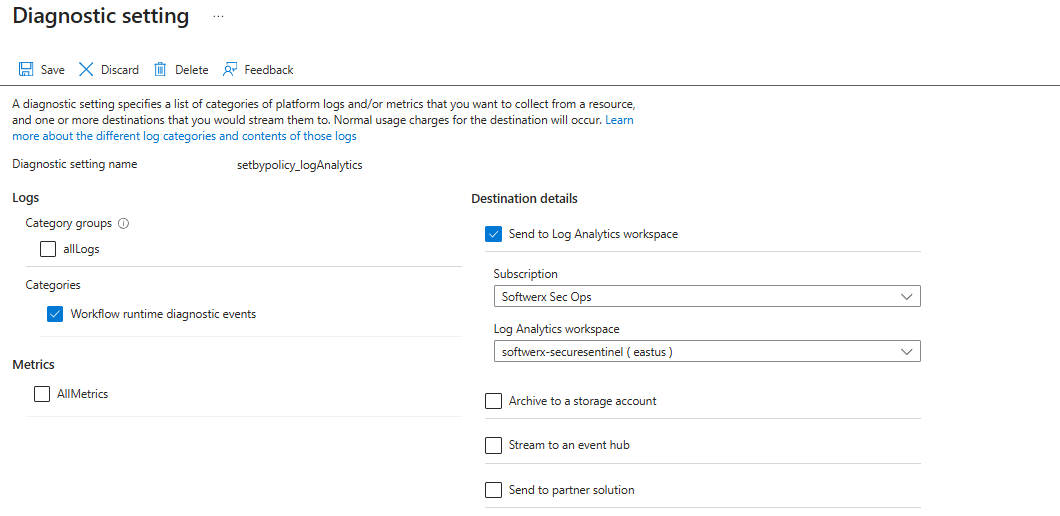
- Route full noise to the Storage Account or Event Hub to save on costs
Step 7 - Checklist for “Sentinel cost spike” incidents
Next time someone pings you with “Why did Sentinel get expensive?”, run this playbook:
- Usage first, not incidents
- Usage table, last 24-48h, 1h bins (or any specific timeframe required)
- Top 10
DataTypeby GB
- Confirm with Workspace Usage Report
- Open the workbook, check which table has jumped (this is sometimes a tricky part, as the culprit may actually be a table that is outside of the top 10; be sure to check it out)
- Screenshot it for the manager
- Drill table -> resource
- Simple KQL:
AzureDiagnostics | summarize count() by Resource, ResourceGroup - Then add
ResourceProvider,Category,OperationName- keep in mind that each table may contain specific columns you need to change, over time, you will build a custom KQL that will help you to find those things easier
- Simple KQL:
- Use Recon Tools if you don't want to write KQL
- Table Explorer -> select noisy table
- Filter columns to show things like ResourceGroup, Caller, UserPrincipalName, Activity, etc
- Identify exact resource (Logic App, VM, FW, user, whatever)
Fix the firehose at the source
Go back to the thing that spiked (whatever table it is), and choke it before it hits Sentinel: tighten its diagnostic settings or agent config so it only sends the categories/event IDs you actually hunt on, put a DCR transform in front of it to drop junk rows and heavy fields at ingestion, route any “we just want it for archive” noise to Storage/Event Hub (or DataLake!) instead of Log Analytics, and back it with a Usage‑based alert on per‑table GB/hour so the next time someone turns on “log everything”, you see it within an hour instead of on the invoice.
Class dismissed