The KQL Playbook (Play #5): The Anomaly Play - Finding the 'Weird'

Alright, class. Take your seats.
In our last beginner session, you became intelligence analysts. You learned to master let and join, weaving together disparate log sources to build a complete narrative of an attack. You can take a single indicator, a user, an IP, a device, and pivot across your entire dataset to see the full picture. You are no longer limited by the boundaries of a single table. You are connecting the dots.
But now you’re facing a new, more profound challenge. All the skills you’ve learned so far have been about finding things you already know to look for. You have a suspicious IP, so you search for it. You have a compromised user, so you investigate them.
But what about the threats you don't know exist? What about the attacks that don't trigger an alert?
Your environment generates millions, if not billions, of logs every day. 99.99% of them are benign. They are the normal, predictable hum of your business. But hidden in that noise is the attacker. The user who logs in from a new country for the very first time. The server that suddenly starts talking to 500 other machines when it normally only talks to 10. The user whose last logon of the day is from an IP address thousands of miles away from their first.
These aren't known "bad" things. They're just... weird. And in our world, "weird" is the thread you pull to unravel a hidden attack.
Today’s play is about hunting for anomalies. We’re moving beyond querying for known indicators and into the world of advanced aggregation. I’m going to teach you how to make KQL profile user behaviour, find statistical outliers, and pinpoint the one event in a million that deserves your attention.
📚 The Complete KQL Playbook Series
You're reading part of The KQL Playbook, a comprehensive five-part journey from KQL beginner to threat-hunting professional. Whether you're just starting out or levelling up your detection skills, each play builds on the last.
The Five Plays:
Play #1: A Beginner's Guide to Talking to Your Data
The pipe (|), where, summarize, project, and sort by. The foundational moves that turn a blank query window into your first real conversations with data.
Play #2: Mastering the Matching Game
The difference between == and =~, when to use has vs. contains, and why one wrong character can blind your entire detection strategy.
Play #3: Taming Messy Dataparse, extract, split, bin, and mv-expand. Your toolbox for wrestling chaotic strings, timestamps, and JSON objects into submission.
Play #4: The Correlation Play: Joining Tables and Enriching Data
Master let, join, and the art of connecting disparate log sources to build complete narratives of attacker movement.
Play #5: The Anomaly Play: Finding the 'Weird'make_set, set_difference, and arg_max. Your weapons for hunting threats you don't already know about.
Jump to Your Level:
Beginner? Start with Play #1
Getting zero results? Play #2 has the answer
Drowning in messy data? Play #3 fixes that
Need to correlate events? Play #4
Ready to hunt anomalies? Play #5
Remember: Don't try to memorise syntax. Master the mindset. Every complex query is just these fundamentals chained together with pipes.
Building Intelligence Profiles with make_set
To find what's abnormal, you must first define what is normal. For any given user, what countries do they usually log in from? This "pattern of life" is your baseline. The make_set() aggregation function is your primary tool for building these baselines.
Scenario: "Has a user logged in from a new country for the first time?"
This is a classic threat hunting question. Looking at your SigninLogs schema, the country information is stored in a nested JSON field: LocationDetails.countryOrRegion. We need to extract this data to build our baseline.
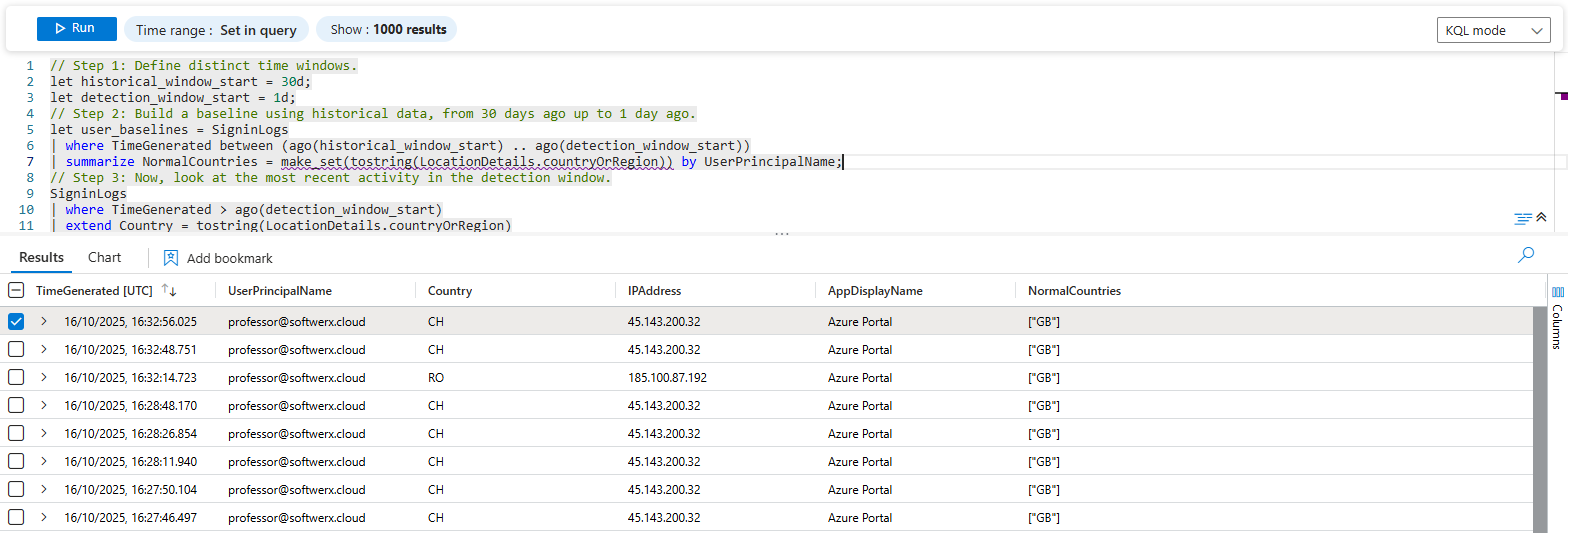
The Play: Baselining User Locations
The key to any anomaly detection is ensuring your historical baseline is clean and separate from the data you are actively analyzing. A professional analyst achieves this by creating distinct, non-overlapping time windows for the baseline and the detection.
// Step 1: Define distinct time windows.
let historical_window_start = 30d;
let detection_window_start = 1d;
// Step 2: Build a baseline using historical data, from 30 days ago up to 1 day ago.
let user_baselines = SigninLogs
| where TimeGenerated between (ago(historical_window_start) .. ago(detection_window_start))
| summarize NormalCountries = make_set(tostring(LocationDetails.countryOrRegion)) by UserPrincipalName;
// Step 3: Now, look at the most recent activity in the detection window.
SigninLogs
| where TimeGenerated > ago(detection_window_start)
| extend Country = tostring(LocationDetails.countryOrRegion)
| where isnotempty(Country)
// Step 4: Join today's login with the user's historical profile
| join kind=leftouter user_baselines on UserPrincipalName
// The hunt: Find logins where today's country is not in the historical list.
| where isnotempty(NormalCountries) and NormalCountries !contains Country
| project TimeGenerated, UserPrincipalName, Country, IPAddress, AppDisplayName, NormalCountries
Let's break down this professional technique:
- Create Time Windows: The query starts by defining two timeframes. The most critical part is the baseline query:
where TimeGenerated between (ago(30d) .. ago(1d)). This command tells KQL to build a profile using data from the past 29 days, ending yesterday. Crucially, it excludes today's logs. This prevents the activity you're trying to detect from contaminating your baseline of "normal" behaviour. - Build the Baseline: The
summarize NormalCountries = make_set(...)command then creates a clean historical profile for each user. If a user has only ever logged in from the "UK" in the past month, their baseline will be a simple["UK"]. - Analyse Recent Activity: The main part of the query then looks only at the most recent data, in this case, the last 24 hours (
> ago(1d)). - Compare and Detect: After joining the recent activity with the historical baseline, the final
where NormalCountries !contains Countryclause does the work. It compares a recent login from "CH (Switzerland) against the historical baseline of["UK"]. Since "CH" is not in the list, the query flags it as a true anomaly.
This approach of separating your baseline from your detection window is fundamental to building reliable anomaly hunts. It ensures you're always comparing the "now" against a true representation of the "then."
The Power Move: Finding What's New with set_difference
The !contains method is great for finding a single anomaly. But what if you want to compare two lists and see exactly what has changed? For this, we use the set_difference() function. It takes two arrays and tells you which items are in the first array but not in the second.
Scenario: "Show me a summary of all new applications each user has accessed today compared to the last 30 days."
This is a fantastic way to spot credential theft. If an attacker gains access to an account, they'll often start exploring and accessing applications the legitimate user never touches.
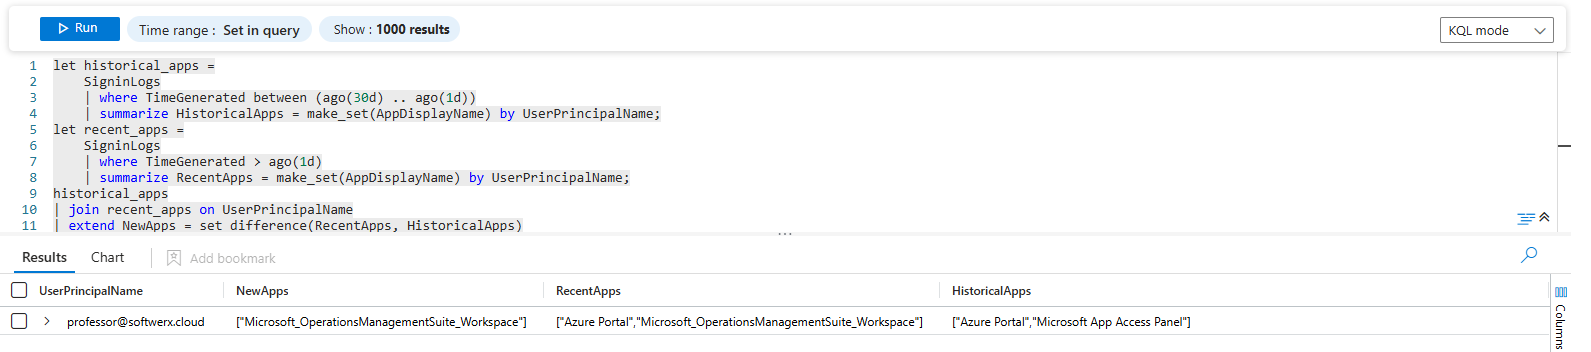
The Play: Comparing Application Usage Over Time
let historical_apps =
    SigninLogs
    | where TimeGenerated between (ago(30d) .. ago(1d))
    | summarize HistoricalApps = make_set(AppDisplayName) by UserPrincipalName;
let recent_apps =
    SigninLogs
    | where TimeGenerated > ago(1d)
    | summarize RecentApps = make_set(AppDisplayName) by UserPrincipalName;
historical_apps
| join recent_apps on UserPrincipalName
| extend NewApps = set_difference(RecentApps, HistoricalApps)
| where array_length(NewApps) > 0
| project UserPrincipalName, NewApps, RecentApps, HistoricalApps
This is how you build a behavioural analytic:
- We create two profiles:
historical_apps(everything used in the last month) andrecent_apps(everything used today). - We
jointhese two profiles together onUserPrincipalName. Now each user has a row with both their historical app list and their recent app list. extend NewApps = set_difference(RecentApps, HistoricalApps): This is the key. It compares the two lists and creates a new list calledNewAppscontaining only the applications that appear inRecentAppsbut were not inHistoricalApps.where array_length(NewApps) > 0: This simple filter gets rid of all the users whose behaviour hasn't changed, leaving you only with those who have used at least one new application.
Finding the Smoking Gun with arg_max()
Sometimes you don't want a summary of all events; you want the single most important one. For example, to find a user's last activity of the day, a rookie might use summarize max(TimeGenerated) by UserPrincipalName. This is a dead end. It gives you the timestamp, but what about the IP address, the location, and the application from that specific event?
The arg_max() function is your solution. It finds the row with the maximum value in one column and returns any or all of the other columns from that same row.
Scenario: "For each user, show me the full details of their LAST logon of the day."
This is incredibly useful for spotting impossible travel scenarios or after-hours activity.
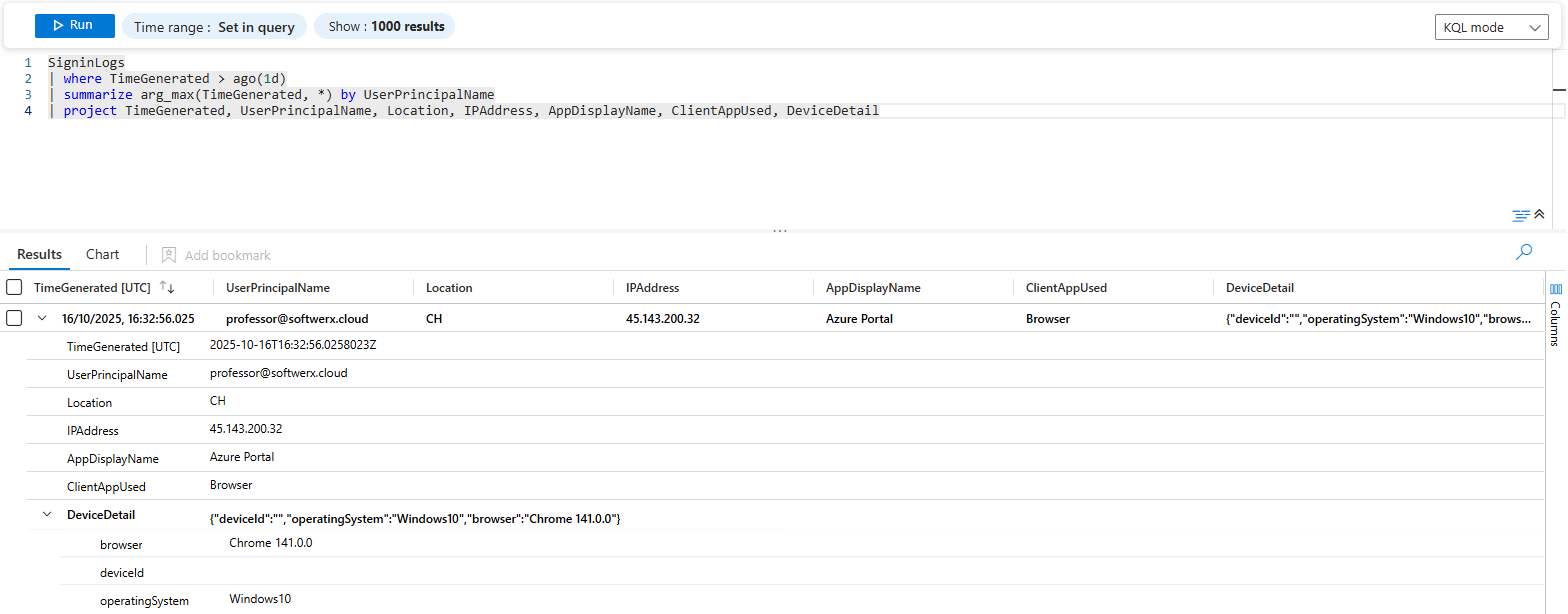
The Play: Pinpointing the Most Recent Event
SigninLogs
| where TimeGenerated > ago(1d)
| summarize arg_max(TimeGenerated, *) by UserPrincipalName
| project TimeGenerated, UserPrincipalName, Location, IPAddress, AppDisplayName, ClientAppUsed, DeviceDetail
This query looks simple, but it's one of the most powerful in KQL.
summarize ... by UserPrincipalName: As always, we are grouping all events for each user.arg_max(TimeGenerated, *): This is the magic. In plain English, you're telling KQL: "For each user group, find the single row that has the maximum (most recent)TimeGenerated. Once you've found that specific row, the*tells me you should bring back all (*) the other columns from it."
Instantly, you have a clean report showing the last known activity for every single user, complete with all the rich context from that one event. You can now easily scan for users whose last logon was at 3 AM or from a suspicious location, without having to run multiple complex queries.
Professor's Pro-Tip: Hunting with Statistics
The ultimate form of anomaly hunting is finding statistical outliers. KQL provides functions to help you do this without needing to be a data scientist.
dcount(): This stands for "distinct count." It's a quick way to find users exhibiting an unusual activity. For example,SigninLogs | summarize IPCount = dcount(IPAddress) by UserPrincipalNamewill instantly show you users who are signing in from a huge number of different IP addresses, which can be a sign of password spraying or credential stuffing attacks.stdev(): This calculates the standard deviation, a measure of how "spread out" a set of numbers is. You can use it to find users whose behaviour is far outside the norm. For example, you could find users whose daily file downloads (stdev(TotalBytes)) are more than three standard deviations above the company average, indicating potential data exfiltration.
These statistical functions allow you to ask powerful questions like, "Show me anyone whose behaviour is more than 2 standard deviations away from the mean," which is the very definition of hunting for the weird.
Your Playbook is Complete
And with that, class is dismissed.
Take a moment and look back at where you started. Just five plays ago, you were standing at the edge of a vast sea of data, armed with little more than a blinking cursor. The where clause was a blunt instrument, join was an intimidating mystery, and the idea of hunting for something you didn't already know existed was a distant concept.
That is no longer you.
You started by turning your queries into a set of surgical tools, learning the critical difference between has and contains. You became a data janitor, taming ugly strings with parse and unpacking cryptic JSON with mv-expand. You graduated to an intelligence analyst, connecting disparate crime scenes into a single narrative with let and join. And today, you've become a hunter, using advanced aggregations like make_set and arg_max to find the faint signal of an anomaly in a mountain of noise.
You are no longer just a log reviewer reacting to alerts. You are an investigator who can ask your own questions of the data. The KQL window is not a barrier; it is your lens. The question is no longer "What does this one log mean?" but "What story is all of this data trying to tell me?"
This playbook has given you the core fundamentals. You have the skills. The only thing left to do is use them. Go back through the plays. Tweak the queries for your own environment. Build your own. Find your own "weird."
The playbook is yours. Now go hunt.