Detection Engineering and Why It's a Must Have Part 2

All right class
This is a continuation of part 1 that you can find here.

How do you turn "we should detect X" into a solid Sentinel analytics rule that fires when it should and shuts up when it shouldn't?
Where Detection Ideas Actually Come From
You shouldn't be inventing detections in a vacuum, and you shouldn't be pulling them purely from vendor content hubs either. Good requirements come from the people closest to the actual work.
SOC analysts see the weird stuff in the queue every day. "I keep seeing suspicious PowerShell from service accounts but there's no rule for it." "We only found this lateral movement by chance while investigating something else." Those comments are detection requirements. If your tooling doesn't give analysts a dead-simple way to log that kind of observation, you're throwing away the best intelligence source you have.
let ServiceAccountPattern = dynamic(["svc_", "sa-", "service.", "SVC-"]);
DeviceProcessEvents
| where TimeGenerated > ago(1h)
| where FileName in~ ("powershell.exe", "pwsh.exe")
| where AccountName has_any (ServiceAccountPattern)
| where ProcessCommandLine has_any (
    "-enc", "-EncodedCommand", "bypass", "hidden",
    "Invoke-WebRequest", "Invoke-Expression", "IEX",
    "Net.WebClient", "DownloadString", "DownloadFile",
    "Start-BitsTransfer", "FromBase64String"
)
| project
    TimeGenerated,
    DeviceName,
    AccountName,
    AccountDomain,
    ProcessCommandLine,
    InitiatingProcessFileName,
    InitiatingProcessCommandLine,
    FolderPath
Threat hunters generate gold. Any KQL hunt that reliably surfaces suspicious behaviour should probably become an analytics rule, heavily tuned, but still. If someone is manually running the same hunt query every week because "it keeps finding things," that's a detection waiting to be written.
Threat intel is where most teams get lazy. Bad teams throw IoCs into a watchlist and feel good about it. Good teams ask the harder question: what behaviour sits behind this indicator, and can we detect that behaviour generically? An IP address ages out in days. The technique that the attacker used to establish persistence might work against your environment for years. Build detections around the technique, not the indicator.
Every major incident should end with a structured question: What detection would have caught this earlier? If the answer is "we didn't have the logs," that's a logging requirement; deal with it there. If the answer is "we had the logs but never looked at them that way," that's a detection requirement; build it now. Most teams do neither and just move on to the next incident.
Red and purple team findings are the most unambiguous source of requirements you'll ever get. Any time your red team moves through your environment without a single Sentinel alert firing, that's not impressive red team work (well, it is for them of course!). That's a documented blind spot with a timestamp on it. Purple teaming in particular is detection engineering on fast-forward. Red shows exactly what they did, blue builds and tunes until those techniques light up the board.
When someone actually reverses a piece of malware, you get exact process names, registry keys, command-line patterns, DLL load behaviours. Yes, Defender for Endpoint covers a lot of this automatically. No, it doesn't cover everything, especially in legacy or niche environments. Detection engineers should be harvesting those behaviours for Sentinel rules where coverage genuinely doesn't exist elsewhere.
Triage: What's Actually Worth Building?
Your intake queue will always be bigger than your capacity. So you triage ruthlessly.
Is this tied to an active campaign or a realistic threat for your organisation, or is it just interesting? Interesting doesn't justify weeks of engineering work. Active and realistic does.
If this behaviour goes undetected, what's the actual blast radius? Lost workstation or full domain compromise? Severity drives priority. Don't treat them as the same.
Do you even run the technology being targeted? This sounds obvious and gets ignored constantly. Teams inherit content hub templates and enable rules for services they don't use, data sources they don't collect, and attack paths that don't apply to their environment. No Exchange on-premises? Stop writing Exchange detection rules. The time you spend maintaining irrelevant detections is time you're not spending on the ones that matter.
Is there working exploit code in the wild, or just a lab proof-of-concept from three years ago that never went anywhere?
Effort versus value matters too. A month of engineering work to detect something barely relevant to your organisation is a bad trade. Two hours for a high-value detection covering a known active technique is a great one.
This is also where ownership gets assigned. Every detection that makes it past triage needs a named person responsible for building it, testing it, and maintaining it when it drifts. "Security owns it" means nobody owns it.
The Logging Reality Check Nobody Does Properly
This is where most detection requests die. And it's better they die here than as useless rules sitting enabled in Sentinel, quietly catching nothing.
Before you write a single line of KQL, answer one question: do you collect the data this rule needs, for the assets it cares about, at the right quality?
Take some concrete Sentinel examples.
You want to alert whenever a critical config file changes on your domain controllers. That means you need Sysmon Event ID 11 (FileCreate) landing in the Event table for those servers, or Defender for Endpoint DeviceFileEvents covering those devices, or Windows Security logs with object access auditing correctly configured and flowing. If none of that exists, you're not starting a detection project. You're starting a logging project. Know which one you're actually doing.
You want to detect suspicious sign-ins to Entra ID. Do you have SigninLogs table populated in Sentinel? Are you only ingesting interactive sign-ins, or also non-interactive and service principal sign-ins? If you half-configured the diagnostic settings six months ago and never verified what was actually landing, your KQL is scanning empty or partial data. Go check before you write anything.
// Logging reality check: Are you actually collecting what you think you are?
// Run this BEFORE writing any SigninLogs detection

// Check 1: Entra ID sign-in coverage
let Interactive =
    SigninLogs
    | where TimeGenerated > ago(24h)
    | summarize Interactive = count()
    | extend JoinKey = 1;
let NonInteractive =
    AADNonInteractiveUserSignInLogs
    | where TimeGenerated > ago(24h)
    | summarize NonInteractive = count()
    | extend JoinKey = 1;
Interactive
| join kind=fullouter NonInteractive on JoinKey
| project
    Interactive = coalesce(Interactive, 0),
    NonInteractive = coalesce(NonInteractive, 0)
| extend
    Total = Interactive + NonInteractive,
    Coverage = iff(
        NonInteractive == 0,
        "⚠️ Non-interactive logs NOT flowing",
        "✅ Full Entra coverage"
    )

// Check 2: SecurityEvents coverage
SecurityEvent
| where TimeGenerated > ago(24h)
| summarize
    EventCount = count(),
    DistinctComputers = dcount(Computer),
    Computers = make_set(Computer, 20)
    by EventID
| sort by EventID asc

// Check 3: Are DeviceProcessEvents populated for the devices you care about?
DeviceProcessEvents
| where TimeGenerated > ago(24h)
| summarize
    TotalEvents = count(),
    DistinctDevices = dcount(DeviceName)
| extend HealthCheck = iff(
    TotalEvents == 0,
    "⚠️ No process events — check MDE onboarding and Sentinel connector",
    strcat("✅ ", TotalEvents, " events from ", DistinctDevices, " devices")
)
You want to build Windows security event detections. Is Azure Monitor Agent pulling that information into Sentinel? Have you checked event volume so you're not about to blow your ingestion budget? AMA is the only supported collection path at this point. If anyone in your environment is still running the legacy Microsoft Monitoring Agent, that's end-of-life infrastructure and any detection gaps you find there are partly a legacy problem, not just a configuration issue.
You want to catch web usage policy violations. Is there a connector bringing proxy or firewall logs into Sentinel through CommonSecurityLog or a vendor-specific table? Are the URL and FQDN fields actually populated, or are you only logging destination IPs? Does traffic even go through a proxy, or is there direct internet breakout you're not accounting for? If the network team sent "sample logs" six months ago and never finished the integration, you're blind. Full stop.
Before development starts, you need clear answers to four things. Which Sentinel tables will this rule query? Are those tables populated for the relevant assets? Are the key fields reliable and not randomly empty? Do you understand how to scope the rule correctly across DCs, workstations, Azure resources, or all of the above? If you can't answer those, you're not ready to build the detection.
Choosing How You'll Actually Detect It
Once the data story checks out, you need to decide what kind of detection you're building. This decision shapes everything downstream.
Static indicators are hashes, IPs, domains, specific registry paths, exact command lines. Fast to build in Sentinel, usually a simple where clause against Defender tables or network logs. They're also short-lived and trivially evaded. Use them for tactical coverage during active campaign, definitely use Threat Intelligence from Microsoft and TI Maps analytic rules to help you out, those will act as a fantastic source of up to date intelligence you can use but don't build your whole programme on them.
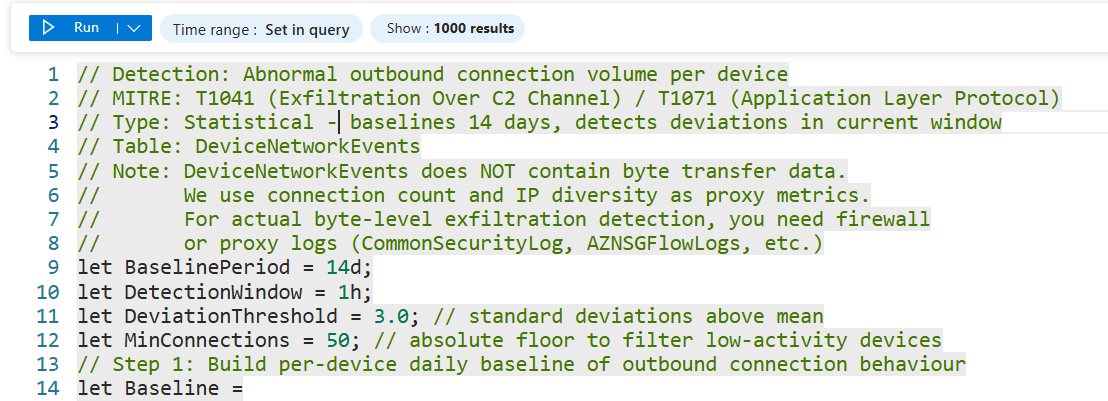
Statistical detections catch "this looks wrong" at scale: massive data egress, logon failure spikes, DNS query volume anomalies, beacon-like timing patterns. They require baselining, typically summarising behaviour per user or device over 7 to 30 days and flagging significant deviations. Good targets in Sentinel are exfiltration patterns in DeviceNetworkEvents, impossible travel in SigninLogs, and abnormal process creation rates in DeviceProcessEvents. These detections are great at catching behaviour that doesn't match any known signature but is clearly outside normal for that entity.
// Detection: Abnormal outbound connection volume per device
// MITRE: T1041 (Exfiltration Over C2 Channel) / T1071 (Application Layer Protocol)
// Type: Statistical - baselines 14 days, detects deviations in current window
// Table: DeviceNetworkEvents
// Note: DeviceNetworkEvents does NOT contain byte transfer data.
//       We use connection count and IP diversity as proxy metrics.
//       For actual byte-level exfiltration detection, you need firewall
//       or proxy logs (CommonSecurityLog, AZNSGFlowLogs, etc.)
let BaselinePeriod = 14d;
let DetectionWindow = 1h;
let DeviationThreshold = 3.0; // standard deviations above mean
let MinConnections = 50; // absolute floor to filter low-activity devices
// Step 1: Build per-device daily baseline of outbound connection behaviour
let Baseline =
    DeviceNetworkEvents
    | where TimeGenerated between (ago(BaselinePeriod) .. ago(DetectionWindow))
    | where ActionType == "ConnectionSuccess"
    | where RemoteIPType == "Public"
    | summarize
        DailyConnections = count(),
        DailyDistinctIPs = dcount(RemoteIP)
        by DeviceName, DeviceId, bin(TimeGenerated, 1d)
    | summarize
        AvgDailyConnections = avg(DailyConnections),
        StdDevConnections = stdev(DailyConnections),
        AvgDailyDistinctIPs = avg(DailyDistinctIPs),
        StdDevDistinctIPs = stdev(DailyDistinctIPs)
        by DeviceName, DeviceId;
// Step 2: Measure current window
let CurrentWindow =
    DeviceNetworkEvents
    | where TimeGenerated > ago(DetectionWindow)
    | where ActionType == "ConnectionSuccess"
    | where RemoteIPType == "Public"
    | summarize
        CurrentConnections = count(),
        CurrentDistinctIPs = dcount(RemoteIP),
        TopRemoteIPs = make_set(RemoteIP, 10),
        TopRemoteUrls = make_set(RemoteUrl, 10),
        TopProcesses = make_set(InitiatingProcessFileName, 10)
        by DeviceName, DeviceId;
// Step 3: Compare current window against baseline
CurrentWindow
| join kind=inner Baseline on DeviceId
// Calculate how many standard deviations above normal
| extend ConnectionDeviations = iff(
    StdDevConnections == 0, 0.0,
    round((CurrentConnections - AvgDailyConnections) / StdDevConnections, 1)
)
| extend IPDeviations = iff(
    StdDevDistinctIPs == 0, 0.0,
    round((CurrentDistinctIPs - AvgDailyDistinctIPs) / StdDevDistinctIPs, 1)
)
// Flag if EITHER metric is anomalous
| where ConnectionDeviations > DeviationThreshold
    or IPDeviations > DeviationThreshold
| where CurrentConnections > MinConnections
| project
    DeviceName,
    CurrentConnections,
    AvgDailyConnections = round(AvgDailyConnections, 0),
    ConnectionDeviations,
    CurrentDistinctIPs,
    AvgDailyDistinctIPs = round(AvgDailyDistinctIPs, 0),
    IPDeviations,
    TopRemoteIPs,
    TopRemoteUrls,
    TopProcesses
| sort by ConnectionDeviations descBehavioural detections are where things get harder and more valuable. These focus on patterns of activity and relationships between events, not just what happened but what happened in context. A concrete Sentinel example: DeviceProcessEvents where ParentProcessName == "WINWORD.EXE" and ProcessCommandLine contains suspicious PowerShell, correlated with network activity in DeviceNetworkEvents for that same process ID. You're not looking for a known bad hash or a specific IP. You're looking for Word spawning PowerShell and then making network connections. That behaviour pattern holds regardless of what specific payload is being delivered. Attackers hate these detections because changing the tool doesn't change the technique.
let SuspiciousSpawns =
    DeviceProcessEvents
    | where TimeGenerated > ago(1h)
    | where InitiatingProcessFileName in~ (
        "WINWORD.EXE", "EXCEL.EXE", "POWERPNT.EXE", "OUTLOOK.EXE"
    )
    | where FileName in~ (
        "powershell.exe", "pwsh.exe", "cmd.exe",
        "wscript.exe", "cscript.exe", "mshta.exe", "regsvr32.exe"
    )
    | where ProcessCommandLine has_any (
        "-enc", "-EncodedCommand", "bypass", "hidden", "-nop",
        "Invoke-", "IEX", "DownloadString", "DownloadFile",
        "Net.WebClient", "Start-Process", "FromBase64String",
        "rundll32", "regsvr32", "mshta"
    )
    | project
        SpawnTime = TimeGenerated,
        DeviceName,
        DeviceId,
        AccountName,
        ParentProcess = InitiatingProcessFileName,
        ChildProcess = FileName,
        CommandLine = ProcessCommandLine,
        ChildProcessId = ProcessId;
SuspiciousSpawns
| join kind=leftouter (
    DeviceNetworkEvents
    | where TimeGenerated > ago(1h)
    | where RemoteIPType == "Public"
    | project
        NetworkTime = TimeGenerated,
        DeviceId,
        InitiatingProcessId,
        RemoteIP,
        RemotePort,
        RemoteUrl
) on $left.DeviceId == $right.DeviceId,
   $left.ChildProcessId == $right.InitiatingProcessId
| extend MadeNetworkConnection = isnotempty(RemoteIP)
| project
    SpawnTime,
    DeviceName,
    AccountName,
    ParentProcess,
    ChildProcess,
    CommandLine,
    MadeNetworkConnection,
    RemoteIP,
    RemotePort,
    RemoteUrl
| sort by MadeNetworkConnection desc, SpawnTime desc
Luckily for us, Microsoft is doing a great job of bringing UEBA and incident correlation to the forefront, which makes detection that much easier.
Writing KQL That Doesn't Suck
Now you're allowed to open the analytics rule wizard. But don't start there.
Plan first. Write down the tables involved, the join conditions (DeviceId, AccountSid, IP, CorrelationId, whatever ties the events together), exactly what behaviour should trigger an alert, and what you'll use to reduce false positives. If you can't describe the detection in plain language before you write KQL, the KQL will be a mess.
Start with a hunting query in the Logs blade, not an analytics rule. Test it against the last 7 to 30 days of real data. See what it finds and how noisy it is. If it's garbage as a hunting query, it'll be worse as a scheduled rule running every hour. Fix it at the hunting stage where the feedback loop is fast.
Take the hits you get and make decisions. For each result, ask whether it's a real issue, benign admin behaviour, or junk. Add filters, exclusions, or behavioural refinements to kill the junk. Resist the urge to hard-code too many environment-specific values unless you have a maintenance plan for them.
Watch the query running time. Use narrow time windows, typically one to six hours per scheduled run. Put your where filters on TimeGenerated early. Summarise by key fields before joining where you can. It's not a requirement, but writing a good piece of KQL is a fantastic practice.
let LookbackPeriod = 14d;
let DetectionWindow = 1h;
let Threshold = 3.0; // standard deviations
let MinFailures = 10; // absolute minimum to avoid low-volume false positives
// Build per-user daily failure baseline
let Baseline =
    SigninLogs
    | where TimeGenerated between (ago(LookbackPeriod) .. ago(DetectionWindow))
    | where ResultType != 0
    | summarize DailyFailures = count()
        by UserPrincipalName, bin(TimeGenerated, 1d)
    | summarize
        AvgDaily = avg(DailyFailures),
        StdDev = stdev(DailyFailures)
        by UserPrincipalName;
// Compare current window
SigninLogs
| where TimeGenerated > ago(DetectionWindow)
| where ResultType != 0
| summarize
    CurrentFailures = count(),
    DistinctIPs = dcount(IPAddress),
    IPs = make_set(IPAddress, 10),
    Apps = make_set(AppDisplayName, 5),
    ErrorCodes = make_set(ResultType, 10)
    by UserPrincipalName
| join kind=inner Baseline on UserPrincipalName
| where CurrentFailures > MinFailures
| where CurrentFailures > (AvgDaily + (Threshold * StdDev))
| project
    UserPrincipalName,
    CurrentFailures,
    AvgDaily = round(AvgDaily, 1),
    StdDev = round(StdDev, 1),
    DistinctIPs,
    IPs,
    Apps,
    ErrorCodes
| sort by CurrentFailures desc
Document the reasoning somewhere, in the rule description, in comments in your KQL repo, anywhere. Capture the threat scenario, the MITRE mapping, the required data sources, the known false positive patterns, and who last reviewed it and when. Future you will have no memory of why you made that weird exception for svc_backup at 11 pm on a Tuesday. The easiest way is to comment out part of the KQL using "//"
Testing Before It Wakes the SOC
Use the query preview in the analytics rule wizard to look at results over time. Zero hits may mean that you're either not collecting the data or the logic is wrong. Double-check. Thousands of hits mean you've built a noise cannon, not a detection.
In your lab or a controlled pilot environment, run the actual behaviour you're targeting. If you're building a detection for Word spawning PowerShell with an encoded command, open Word, fire a macro that does exactly that, and verify the event lands in DeviceProcessEvents within your expected query window. If you can't generate the behaviour yourself in a safe environment, you can't prove the detection works (in most of the cases, there are of course cases where you can do it easily). That's not a detection, it's a hope.
DeviceProcessEvents
| where TimeGenerated > ago(15m)
| where DeviceName =~ "YOUR-TEST-DEVICE"
| where InitiatingProcessFileName in~ ("WINWORD.EXE", "EXCEL.EXE")
| where FileName in~ ("powershell.exe", "cmd.exe")
| project
    TimeGenerated,
    DeviceName,
    InitiatingProcessFileName,
    FileName,
    ProcessCommandLine,
    ProcessId
| sort by TimeGenerated desc
Have SOC analysts review the test alerts before anything goes live. Do they have enough context in the entity mappings, custom details, and alert description to actually investigate? Is the severity realistic? Are there enrichment steps you should be automating, like IP reputation lookups or pulling user details, that would save the analyst time? Fix the rule before production, not after it's generated three hundred tickets.
Ship It, Watch It, Fix It
Roll out in alert-only mode first. No automated response yet. The reason matters. Automation rules that trigger response actions like disabling accounts, blocking IPs, or isolating hosts on a detection you haven't validated can cause real damage. A misconfigured response automation on a noisy rule can take out legitimate users or systems before anyone realises what's happening. Trust the detection first. Add automation after.
Watch alert volume and quality closely in the first days and weeks. Is it firing when it should? Is it firing when it shouldn't? Those are two different problems with different fixes.
Give analysts a dead-simple way to tag alerts: useless, needs tuning, or this is gold. Then act on that feedback on a schedule. Detection engineers should be reviewing analyst feedback regularly and updating rules, not just shipping new ones indefinitely while old ones quietly degrade.
Treat detections like code. Versioned, reviewed, tested, and retired when obsolete. A detection that made sense eighteen months ago might be mapping to a log source that changed, a technique that evolved, or an asset that no longer exists in your environment. Rules rot. Schedule the maintenance or accept the drift.
Practical Next Steps
Pick one real incident or threat scenario and run it through the whole lifecycle right now. Requirement, triage, logging check, KQL, test, deploy. Don't plan to do it. Do one.
Build a simple intake and triage board in whatever you already use, Azure DevOps, Jira, a Notion page, anything, with owners and statuses on every detection request. The tool doesn't matter. The visibility does.
Do a logging reality check for your top three planned detections. Verify the required Sentinel tables are populated, the key fields are reliable, and the asset scope is correct. Do this before writing any KQL.
Start a Git repository for detections as code, KQL files, ARM or Bicep templates for rules, and documentation, if you don't already have one. If you're editing rules directly in the Sentinel portal with no version history, you don't know what you have or what changed.
Schedule a monthly review with the SOC to go over noisy rules, missed detections, and new ideas. Put it in the calendar. If it's not scheduled, it won't happen.