Beyond the Basics: Forging Your Own Custom Detections in Defender XDR

Alright, class.
You've started to notice something. Sentinel is the brilliant general in the command tent, seeing the whole battlefield. The actual guards on the walls, the soldiers fighting in the trenches—that's the Microsoft Defender XDR suite.
And sometimes, you need to give those guards a very specific set of new orders.
This is where Custom Detection Rules in Defender XDR come in. They are different from Sentinel's Analytic Rules. A Sentinel rule is for correlating logs from different sources (SigninLogs + CommonSecurityLog). A Defender Custom Detection is for creating a native alert directly from the deep, rich telemetry of the Defender stack itself (DeviceProcessEvents, EmailEvents, etc.).
Today, we're going to the forge. We're going to hammer our raw threat hunting queries into sharp, automated detection weapons.
Before You Cook, Check the Cookbook (The Community Queries)
Before you spend hours trying to write the perfect KQL query from scratch, let me give you the single most important piece of advice: don't reinvent the wheel.
The security community is vast and brilliant. Chances are, whatever you're trying to detect, someone else has already tried to hunt for it. Inside Defender XDR, go to Hunting > Advanced hunting. On the left-hand side, click on the Query tab. You'll find a "Community" section full of queries shared by other practitioners. It's a goldmine. Always check the cookbook before you start chopping your own ingredients.
Our First Custom Rule: Watching the Watchers
For our first rule, we're going to do something a little meta. We're going to create a detection that alerts us whenever someone creates, edits, or deletes one of these powerful custom detection rules. It's the security equivalent of putting a camera on the door of your own office.
Here’s the KQL. It's simple but powerful.
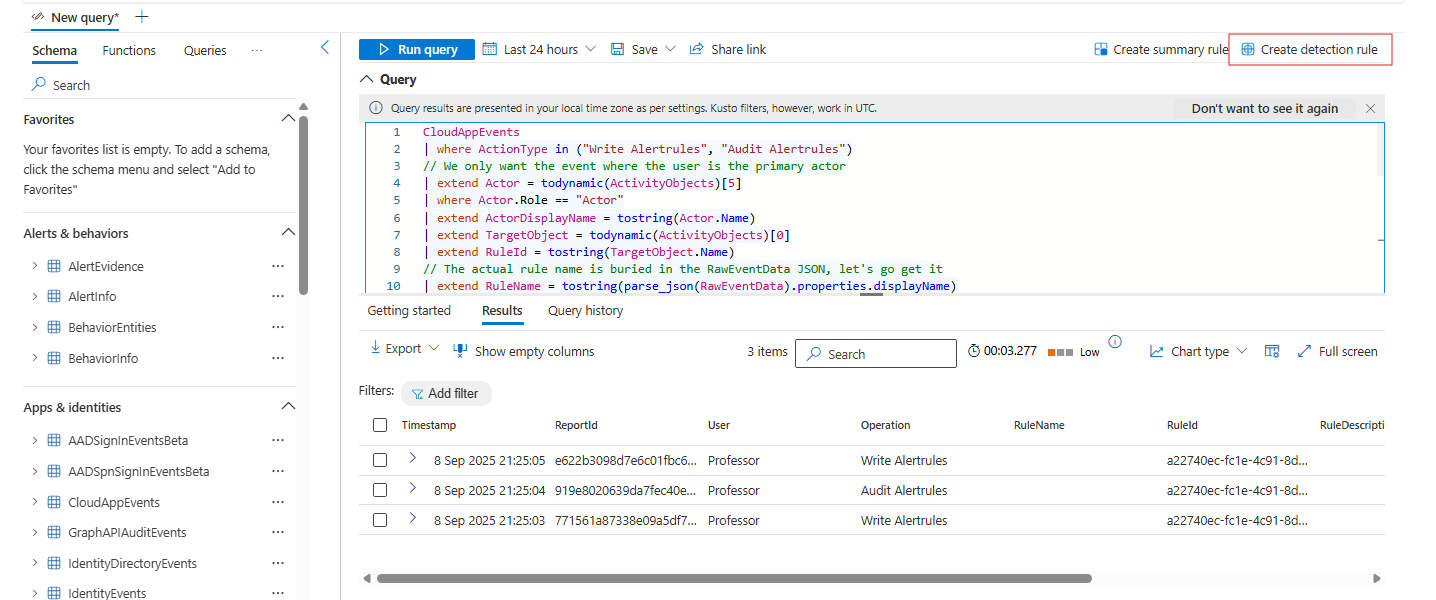
CloudAppEvents
| where ActionType in ("Write Alertrules", "Audit Alertrules")
| extend Actor = todynamic(ActivityObjects)[5]
| where Actor.Role == "Actor"
| extend ActorDisplayName = tostring(Actor.Name)
| extend TargetObject = todynamic(ActivityObjects)[0]
| extend RuleId = tostring(TargetObject.Name)
| extend RuleName = tostring(parse_json(RawEventData).properties.displayName)
| extend RuleDescription = tostring(parse_json(RawEventData).properties.description)
| extend RuleSeverity = tostring(parse_json(RawEventData).properties.severity)
| project
    Timestamp = TimeGenerated,
    ReportId,
    User = ActorDisplayName,
    IPAddress,
    Operation = ActionType,
    RuleName,
    RuleId,
    RuleDescription,
    RuleSeverity
The Golden Rule: Timestamp and ReportId
To create a custom detection, your KQL query MUST output two specific columns: Timestamp and ReportId (when running against Device events DeviceId will be also required) If you project these away or rename them, the "Create detection rule" button will be greyed out, and you will sit there staring at the screen, questioning your life choices, wondering what you did wrong. The query above includes them. Always double-check.
Forging the Rule: The Step-by-Step Guide
- In Advanced hunting, paste the query and run it to make sure it works.
- Once validated, click the Create detection rule button. This opens the wizard.
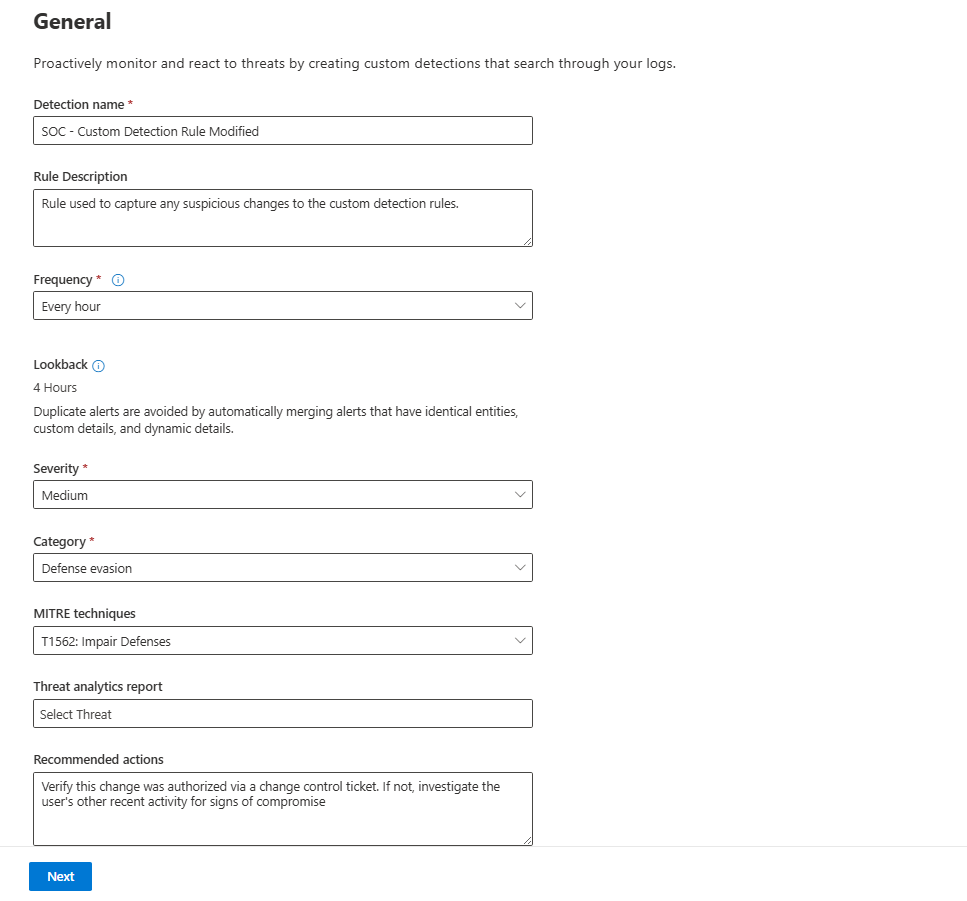
Tab 1: The General Tab (The Rule's ID Card)
- Detection rule name: Give it a clear, human-readable name.
SOC - Custom Detection Rule Modified. - Description: Always add clear information about what the rule is doing.
- Frequency: How often should the query run? You can run it every hour, 3 hours, etc. For something this important, you can even choose Nearly real-time (NRT), which runs every few minutes.
- Severity: How much should we panic? A change to a custom detection is a big deal. Let's set this to Medium.
- Category: Map it to the MITRE ATT&CK framework. Modifying detections is a classic Defense Evasion tactic.
- Threat analytics reports: If this rule relates to a specific threat actor campaign that Microsoft has reported on, you can link it here.
- Recommendation actions: This is your note to your future, sleep-deprived self. What should the analyst do when this fires? Write it down! "Verify this change was authorized via a change control ticket. If not, investigate the user's other recent activity for signs of compromise."
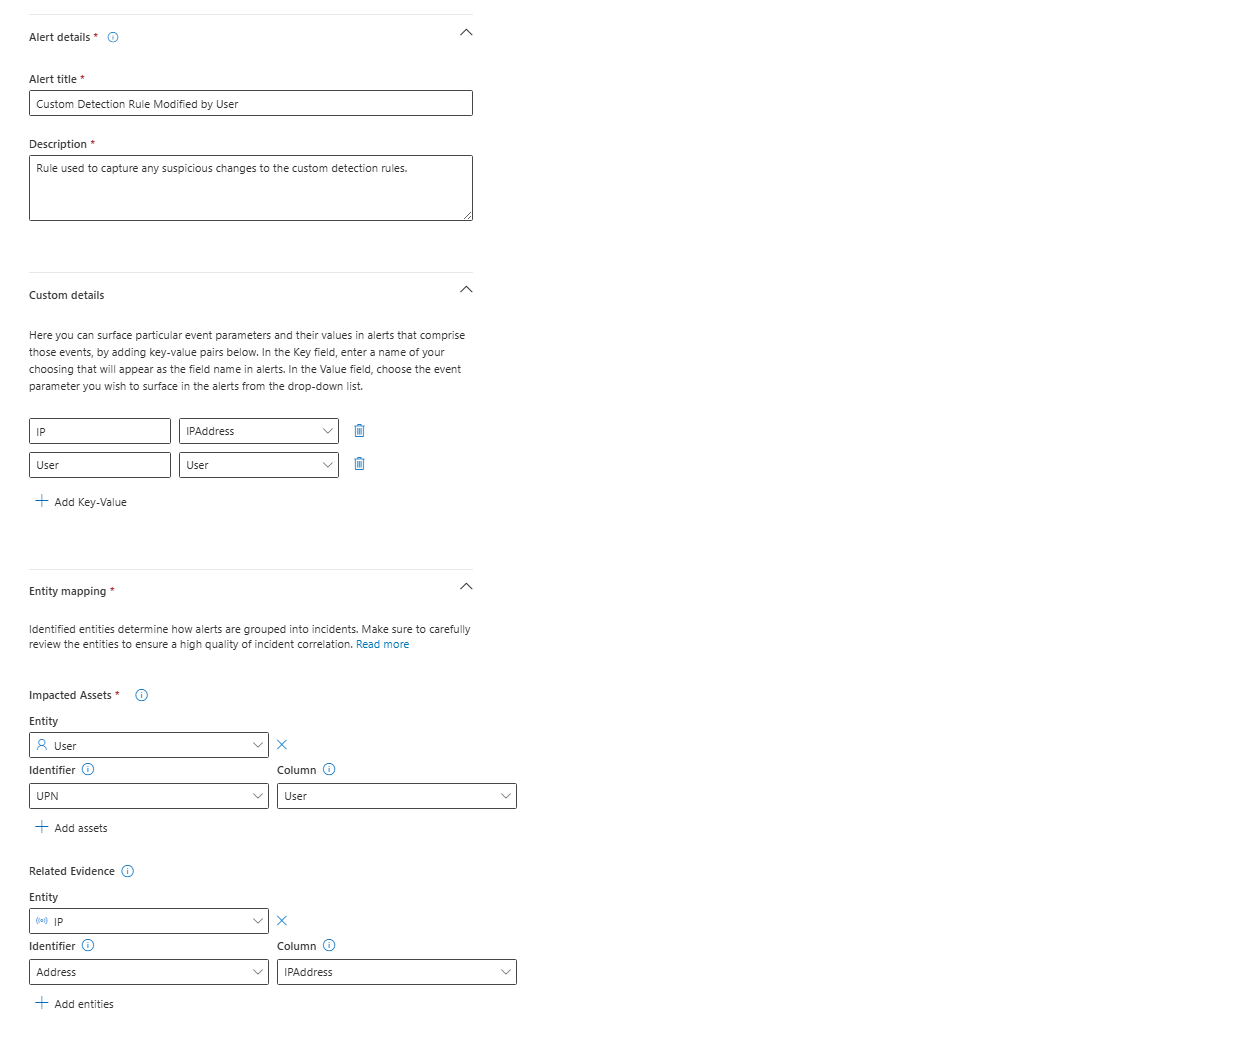
Tab 2: The Alert Settings Tab (The Story You Tell the Analyst)
- Alert title: This is what the analyst sees first. Make it count. Let's use
Custom Detection Rule Modified by User. - Description: Add your own custom description here to give the analyst more context.
- Custom details: Just like in Sentinel, you can surface other columns from your query to appear directly in the alert. Let's add
UserandIPaddressso the analyst can see who made the changes without even having to open the logs. - Entity Mapping: This is the most magical part. You tell Defender which columns in your query represent the key entities. For our query, we have a
Usercolumn. We'll map that to the User entity. This is what unlocks the automation later.
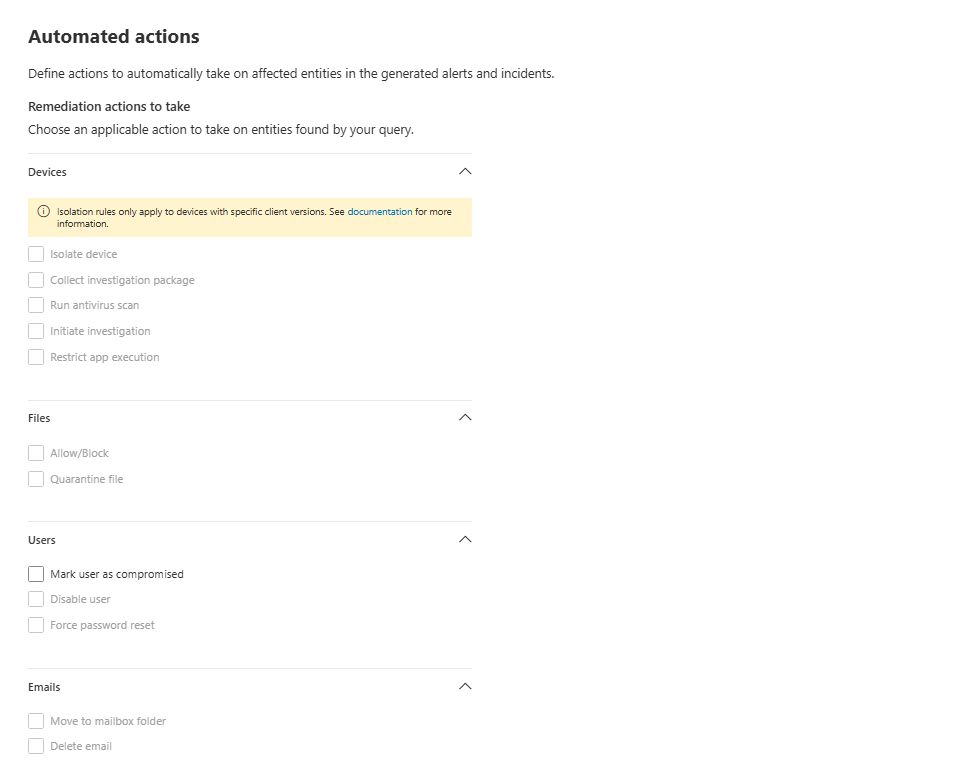
Tab 3: The Automated Actions Tab (The Payoff)
This is where the magic from the previous step pays off. Because we identified a User entity, a list of user-specific actions automatically appears.
- Mark user as compromised: This will flag the user in Entra ID, dramatically increasing their risk score.
- Disable user: The nuclear option. Prevents the user from logging in.
- Force password reset: A mini-nuke that will force the user to change the password.
If our query had identified a DeviceId, we'd see options like "Isolate device" and "Run antivirus scan." If it had a FileName, we'd see "Allow/Block." The actions are context-aware, which is brilliant. For our rule, let's not set an automated action yet, but it's good to know it's there.
Click Next, review your masterpiece, and hit Create.
The Result: A Guard on the Wall
You've done it. The next time anyone, authorized or not, messes with your custom rules, a medium-severity alert will fire. It will appear in the Defender XDR incident queue, and because you have the Sentinel connector, it will also appear in the Sentinel queue, ready for triage.
You've taken a raw threat hunt and turned it into an automated, intelligent, and context-rich alert.
Bonus Spells: Other Simple, High-Value Detections
Ready for more? Here are a couple of other simple but powerful ideas.
1. Promote a Microsoft UEBA Behavior to a Formal Alert
Microsoft's User and Entity Behavior Analytics (UEBA) engine is constantly running, identifying weird stuff. One of these is ActivityFromInfrequentCountry. Usually, this is just an observation. This query turns it into a real, high-severity alert.
BehaviorInfo
| where ActionType == "ActivityFromInfrequentCountry"
| join BehaviorEntities on $left.BehaviorId == $right.BehaviorId
| summarize arg_max(Timestamp, *) by AccountUpn
// Remember the golden rule!
| project Timestamp, AccountUpn, ActionType, Categories, Description, BehaviorId
2. Hunt for Suspicious Processes from Office Apps
A user opening Word is normal. Word spawning PowerShell is... not normal. This is a classic attack pattern.
DeviceProcessEvents
| where InitiatingProcessParentFileName in ("winword.exe", "excel.exe", "powerpnt.exe")
| where FileName in ("powershell.exe", "cmd.exe", "wscript.exe")
| project Timestamp=TimeGenerated, ReportId, DeviceName, AccountUpn=InitiatingProcessAccountUpn, FileName, ProcessCommandLine, DeviceId
Final Thoughts
Custom Detection Rules are the bridge that connects your proactive threat hunting to your reactive incident response. They allow you to codify your own unique knowledge and detection logic, creating a security posture that is tailored perfectly to your environment.
Now go forth and forge your weapons.
Class dismissed.