Hunting Ransomware in Storage Accounts (When You Can't Afford Defender)
Alright, class.
Let's talk about the crown jewels of your Azure kingdom: your Storage Accounts. It's where you keep your critical application data, your backups, your archives, everything that matters. And for an attacker, it's a treasure chest just waiting to be plundered or, even worse, held for ransom.
Now, in a perfect world with an infinite budget, you'd protect this with Microsoft Defender for Cloud. Let's be brutally honest: Defender is the easy button. It's a fantastic, intelligent, AI-driven security blanket that will catch most of what we're about to discuss (and a whole lot more) automatically. If you have the license and the budget, you should absolutely be using it.
But we don't all live in a perfect world. Sometimes, the budget just isn't there (or your boss is too cheap)
So what happens when you're told, "We need to protect our storage, but we can't afford the top-tier solution"? Do you just give up and hope for the best?
Absolutely not. You roll up your sleeves, grab your KQL magnifying glass, and you build your own damn alarm system. Today, we're going to turn your idle Storage Account logs into a high-fidelity ransomware detection engine.
Step 1: Turning on the Lights (Enabling Diagnostic Logs)
You can't hunt what you can't see. First, we need to tell your Storage Accounts to start sending their security logs to Sentinel.
- In the Azure Portal, go to your Storage Account.
- On the left menu, under Monitoring, click Diagnostic settings (you can also skip step one and go directly to Monitor -> Diagnostic settings)
- Click + Add diagnostic setting.
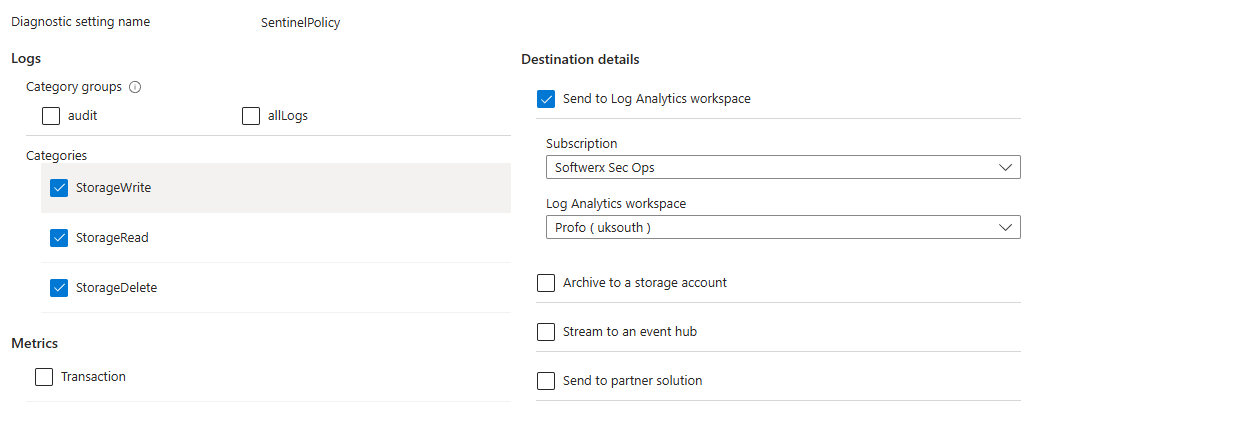
- Give the setting a name, like
Send-To-Sentinel. - Under Logs > Categories, check the box for StorageRead, StorageWrite, and StorageDelete. This is the holy trinity of storage activity.
- Under Destination details, select Send to Log Analytics workspace, and choose the workspace connected to your Sentinel instance.
That's it. Your storage logs will now start flowing into Sentinel, populating a table called StorageFileLogs (for file shares), StorageBlobLogs (for blobs), etc. Now that the lights are on, let's start hunting for monsters.
The Hunt: KQL Detections for Ransomware Behavior
We're going to write three different KQL rules. Each one looks for a different behavioral pattern that screams "ransomware," without ever needing to see a specific malware signature.
Detection #1: The "Smash and Grab" - Mass Write & Delete Activity
The classic ransomware behavior: encrypt a file (a "write" operation) and then delete the original (a "delete" operation), repeated hundreds of times in minutes. This query looks for that exact pattern.
The Scenario: A user's machine gets compromised. The malware on their device uses their credentials to connect to a mapped Azure File Share and begins its destructive rampage.
let timeWindow = 15m;
let writeThreshold = 50;
let deleteThreshold = 50;
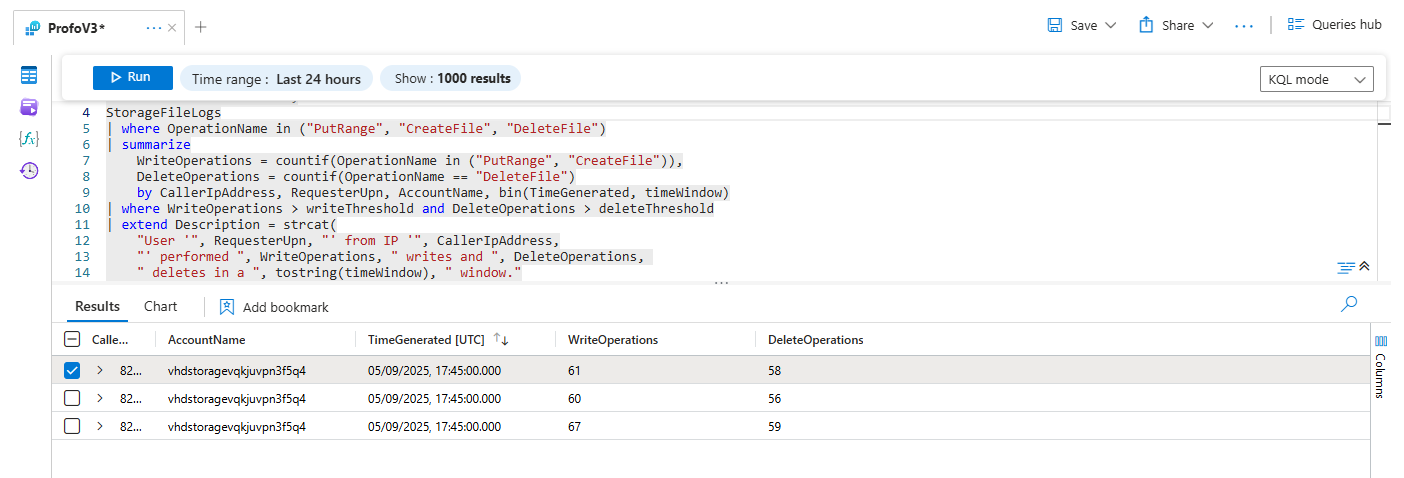
StorageFileLogs
| where OperationName in ("PutRange", "CreateFile", "DeleteFile")
| summarize
WriteOperations = countif(OperationName in ("PutRange", "CreateFile")),
DeleteOperations = countif(OperationName == "DeleteFile")
by CallerIpAddress, RequesterUpn, AccountName, bin(TimeGenerated, timeWindow)
| where WriteOperations > writeThreshold and DeleteOperations > deleteThreshold
| extend Description = strcat(
"User '", RequesterUpn, "' from IP '", CallerIpAddress,
"' performed ", WriteOperations, " writes and ", DeleteOperations,
" deletes in a ", tostring(timeWindow), " window."
)Professor's Breakdown:
- We define our thresholds up top. We're looking for more than 50 writes and 50 deletes within a 15-minute window.
- The
summarizeoperator is the heart of it. It groups all the actions by the user (RequesterUpn) and their IP address, and then counts the number of write and delete operations within each 15-minute bucket. - The final
whereclause only shows us the results where both the write and delete thresholds were breached. This is a very high-confidence alert that something is very wrong (you can also alert the logic slightly, but changing this toorin case you prefer to see separate detections forwritedelete)
Detection #2: The "Ransom Note Drop" - Suspicious File Creation
What's the one thing every ransomware variant does? It leaves a ransom note. These notes often have very predictable names. This query looks for a user creating files with those classic, terrifying names.
The Scenario: An attacker has gained access and, after encrypting the files, they drop the ransom note into every directory to inform the victim of their misfortune.
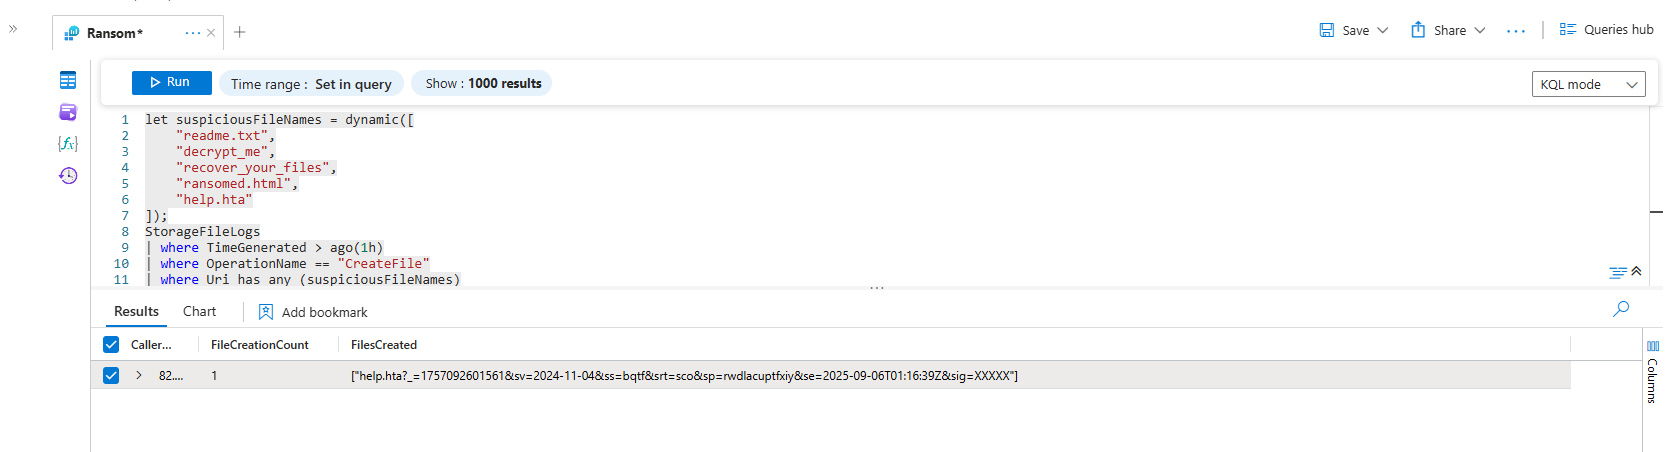
let suspiciousFileNames = dynamic([
    "readme.txt",
    "decrypt_me",
    "recover_your_files",
    "ransomed.html",
    "help.hta"
]);
StorageFileLogs
| where TimeGenerated > ago(1h)
| where OperationName == "CreateFile"
| where Uri has_any (suspiciousFileNames)
| summarize
    FileCreationCount = count(),
    FilesCreated = make_set(tostring(split(Uri, '/')[-1]), 10)
  by
    CallerIpAddress,
    RequesterUpn
Professor's Breakdown:
- We create a
dynamiclist of known ransom note names. You can and should add to this list! - The query looks for any
CreateFileoperations in the last hour where the file name (Uri) contains any of the strings from our suspicious list. - The
summarizeclause then gives you a tidy report: this user, from this IP, created this many suspicious files, and here are the names of those files. It's the digital equivalent of finding the attacker's calling card at the crime scene.
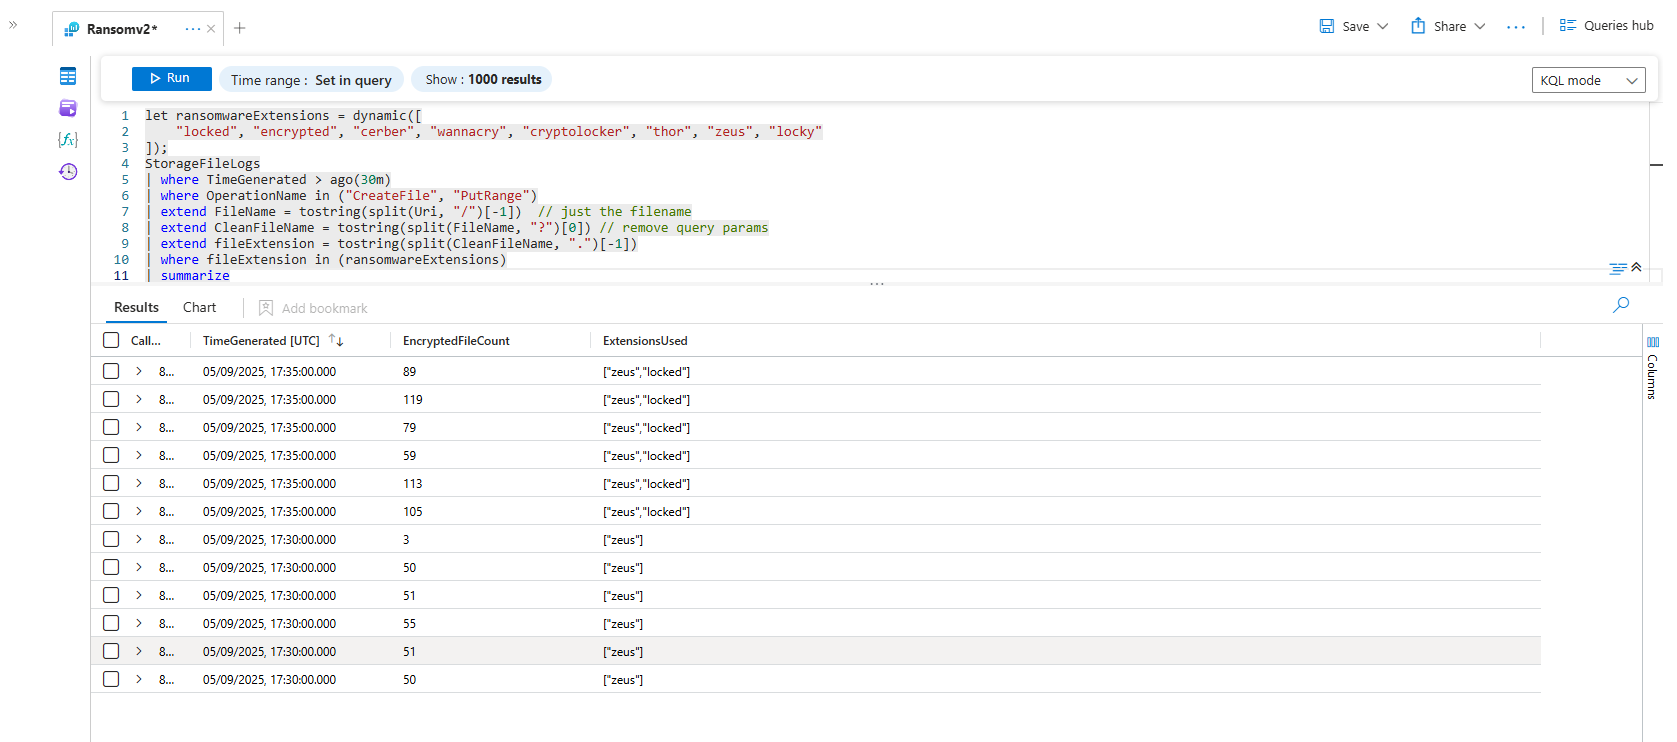
Detection #3: The "Mass Renaming" - Suspicious File Extensions
Another classic ransomware tactic is to encrypt a file (document.docx) and then rename it with a custom extension (document.docx.locked). If you see a user creating hundreds of files with a known ransomware extension in a short period, it's time to panic.
The Scenario: The ransomware is in its final stage, renaming all the newly encrypted files to mark them as locked.
let ransomwareExtensions = dynamic([
    "locked", "encrypted", "cerber", "wannacry", "cryptolocker", "thor", "zeus", "locky"
]);
StorageFileLogs
| where TimeGenerated > ago(30m)
| where OperationName in ("CreateFile", "PutRange")
| extend FileName = tostring(split(Uri, "/")[-1])
| extend CleanFileName = tostring(split(FileName, "?")[0])
| extend fileExtension = tostring(split(CleanFileName, ".")[-1])
| where fileExtension in (ransomwareExtensions)
| summarize
    EncryptedFileCount = count(),
    ExtensionsUsed = make_set(fileExtension, 5)
  by
    CallerIpAddress,
    RequesterUpn,
    bin(TimeGenerated, 5m)
| where EncryptedFileCount > 5 //(Use "1" for testing, otherwise should be changed to "5")
Professor's Breakdown:
- Just like before, we start with a
dynamiclist, this time of known ransomware file extensions. - We use
extendto create a new column calledfileExtensionby splitting the file path (Uri) at the.and taking the last part. - The query then looks for any user who creates more than 5 files with one of these extensions within a 5-minute window. It's a simple, powerful behavioral detection for mass encryption activity.
Bonus Hunts: Beyond Ransomware
Ransomware is noisy. But what about the quieter threats? Here are a few more hunting queries to find subtle, suspicious activity in your storage logs.
Detection #4: The "Unusual User Agent" - Access from Strange Tools
Your employees probably access file shares using the Windows File Explorer, which presents a "Mozilla/5.0" user agent. Your applications use the Azure SDK. If you suddenly see access from a tool like "Rclone," "Aircopy," or a raw "Python-urllib" user agent, that's a massive red flag. These are common data exfiltration tools.
The Scenario: An attacker has compromised a user's machine and is now using a command-line tool to bulk-download sensitive data from a file share, bypassing the normal user interface.
let suspiciousUserAgents = dynamic([
    "Rclone",
    "Aircopy",
    "Python-urllib",
    "Go-http-client",
    "AzCopy" // AzCopy can be legit, but mass usage by a regular user is suspicious (feel free to remove in case of too many false positives (or automate!)
]);
StorageFileLogs
| where TimeGenerated > ago(1d)
| where isnotempty(UserAgentHeader)
| where UserAgentHeader has_any (suspiciousUserAgents)
| summarize
    StartTime = min(TimeGenerated),
    EndTime = max(TimeGenerated),
    Operations = make_set(OperationName, 10),
    TotalEvents = count()
  by
    UserAgentHeader,
    RequesterUpn,
    CallerIpAddress
| extend Description = strcat("Suspicious User Agent '", UserAgentHeader, "' used by '", RequesterUpn, "' from IP '", CallerIpAddress, "'.")
Professor's Breakdown:
This query maintains a list of user agents for tools that are unusual for end-users. It scans the UserAgentHeader field for any matches. When it finds one, it alerts you, summarising what actions were taken by that tool. This is a powerful way to detect data exfiltration or unauthorised access tools that don't try to masquerade as normal browser traffic.
Detection #5: The "Data Hoarder" - Unusually Large Data Egress
This is a simple but effective volume-based detection. You're looking for a single user downloading an abnormally large amount of data. Your HR person might download a few megabytes of files a day. If they suddenly download 10 gigabytes, something is very wrong.
The Scenario: A disgruntled employee who is about to leave the company decides to download the entire customer database or all of the company's intellectual property from a file share.
let timeWindow = 7d;
let lookupWindow = 1d;
// Step 1: Find the baseline of normal authentication types for each user over the last week
let baselineAuth =
    StorageFileLogs
    | where TimeGenerated between (ago(timeWindow) .. ago(lookupWindow))
    | where isnotempty(RequesterUpn)
    | summarize NormalAuthTypes = make_set(AuthenticationType) by RequesterUpn;
// Step 2: Look at the last day's activity and find users using a new auth type
StorageFileLogs
| where TimeGenerated > ago(lookupWindow)
| where isnotempty(RequesterUpn)
| lookup kind=inner (baselineAuth) on RequesterUpn
| where AuthenticationType !in (NormalAuthTypes)
| summarize
    AnomalousAuthTypes = make_set(AuthenticationType),
    EventCount = count()
  by
    RequesterUpn,
    CallerIpAddress
| extend Description = strcat("User '", RequesterUpn, "' used a new authentication method(s) '", tostring(AnomalousAuthTypes), "' not seen in the previous week.")
Professor's Breakdown:
This is a true behavioral anomaly detection. The query first builds a "profile" of each user, listing the AuthenticationType (like Kerberos, SAS, etc.) they have used in the last week. It then looks at today's activity and flags any user who authenticates with a method not in their normal profile. It’s a powerful way to spot an attacker using stolen keys or tokens.
Final Thoughts
Is this as good as Defender for Storage? No. Let's be honest, Microsoft's dedicated security product has sophisticated machine learning models, threat intelligence integration, and far broader detection capabilities.
But is this a thousand times better than having no visibility at all? Absolutely.
By activating your diagnostic logs and using these KQL queries as a starting point, you've taken a passive, unmonitored resource and turned it into an active, instrumented part of your security posture. You've proven that a smart analyst with KQL skills can build powerful, custom detections, even on a budget.
Class dismissed.