Sentinel's Endgame Gear: Sentinel Data Lake

Alright, class.
You’ve tamed your monthly Azure bill. You're filtering logs, using Basic tiers, and your CFO has stopped giving you the evil eye in the hallway. You feel like you've mastered the Sentinel economy.
But then, the auditor arrives.
"We need to see all sign-in activity for a user who left two years ago," they say, smiling politely.
Your blood runs cold. You know those logs are in the "Archive" tier. You start the "rehydration" process, which feels less like a sophisticated cloud operation and more like IP over Avian Carriers you've heard so much about from your coworkers.
You tell the auditor, "Sure, I'll have that for you... in about six hours. Maybe."
If you've ever felt that pain, today's lesson is for you. We're talking about the feature that finally makes long-term data retention in Sentinel not just possible, but powerful: the Azure Data Lake integration.
Why This Isn't Just "Cheaper Storage"
For years, we had to make a painful choice: keep logs for a long time and go broke, or keep them for a short time and pray an attacker wasn't patient. We had workarounds like Auxiliary Logs, but they always felt like a compromise, especially since they weren't supported natively and you had to go through all sorts of shenanigans with DCRs and app registrations to get them working.
Data Lake integration is a bigger, cheaper storage unit. Think of it less like putting your logs in a dusty attic and more like building a searchable, high-tech library of your entire digital history.
Here’s why it's a true game-changer:
- It's Ridiculously Cheap: We're talking pennies on the dollar compared to keeping data "hot" in Log Analytics for years. For compliance requirements (like keeping logs for 7 years), this is a financial no-brainer.
- It's Fast (Finally!): Forget the long rehydration process. Querying your logs in the Data Lake is way faster than doing it from the Archive. You can answer that auditor's question during the same meeting.
- The Magic: Historical Context on Demand: This is the legendary loot. It transforms your archive from a dusty, inaccessible library into a powerful research tool. You can now take a suspicious IP from an alert today and, in the same investigation, instantly check if it has ever been seen in your network over the past 5 years. This level of live enrichment was practically impossible before.
- Data Liberation: The logs are stored in an open, standardised format within the Microsoft-managed data lake. This structure means the data isn't locked away in a proprietary black box. You have the ability to access it with other powerful tools like Azure Synapse for heavy-duty data science, giving you more ways to use your data.
Psst…It’s Still Preview. So Don’t Go All-In Just Yet.
Yes, Data Lake is shiny and new, but public preview means it’s still a bit like beta coffee - promising, but occasionally bitter.
- It’s only in certain regions right now.
- Azure and Sentinel must stay in the same region as your tenant’s home geography.
- Test it in a sandbox—don’t wreck production before you know what you’re doing.
The Big Trade-Off: Hot vs. Cold Storage
Before we build, you need to understand the two tiers of data you'll be working with.
| Feature | Analytics Tier (Hot) | Data Lake Tier (Cold) |
|---|---|---|
| Main Use | Detection rules, dashboards, threat hunting | Compliance storage, historical investigations, cost-efficient retention |
| Query Speed | Fast (seconds) | Slower (minutes, but faster than Archive) |
| Retention | Up to 2 years | 12 years |
| Cost | High (premium storage) | Lower (cold storage) |
| Data Types | Core security logs, high-value signals | Bulk telemetry, noisy sources, long-tail data |
| Access | KQL queries in Analytics workspace | KQL jobs via Data Explorer, with results written back |
Think of the Analytics Tier as the VIP section of your club: expensive, fast service, and where all the action happens. The Data Lake Tier is the massive, cheap warehouse out back where you store everything else. You can go get stuff when you need it, but it takes a bit longer.

Pricing
| SKU / Meter | Unit | Price (USD) |
|---|---|---|
| Data lake ingestion | Data Processed (GB) | $0.05 |
| Data lake storage | Data Stored (GB/month) | $0.023 |
| Data exploration (search) | Data Processed (GB) | $0.0075 |
| KQL jobs | Data Processed (GB) | $0.10 |
| Results written back to Analytics | Data Written (GB) | $0.05 |
Setting Up Your Legendary Archive
The best part about this new feature is that Microsoft handles the heavy lifting. You're not building a complex data pipeline from scratch; you're simply onboarding to a fully managed service.
The Prerequisites
- Unified Portal: Your Microsoft Sentinel workspace must be connected to the Microsoft Defender XDR portal.
- The Right Keys: You need Subscription Owner permissions on the Azure subscription you plan to use for billing (this is so you can connect Unified Portal)
- Geography Matters: During the preview, your Sentinel workspace should be in your tenant's home region.
The Onboarding Quest
- The Starting Point: Navigate to the Microsoft Defender XDR portal at
security.microsoft.com. - Find the Hidden Lair: Go to Settings > Microsoft Sentinel > Data lake.
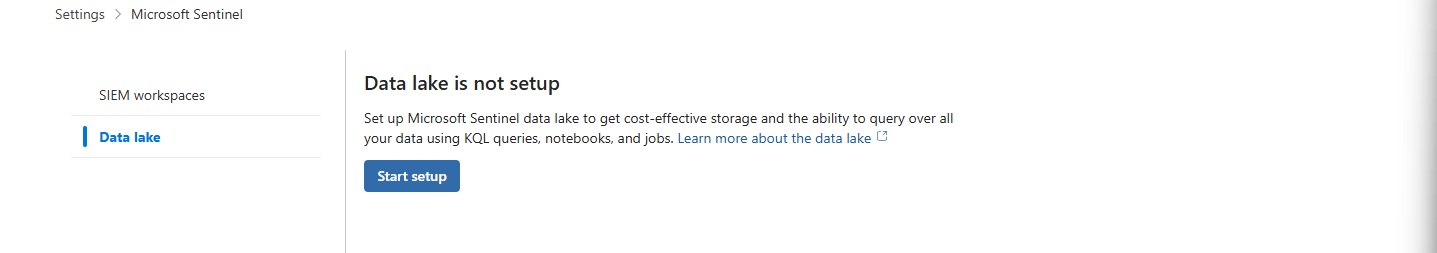
- The Wizard Awaits: Click the Start setup button.
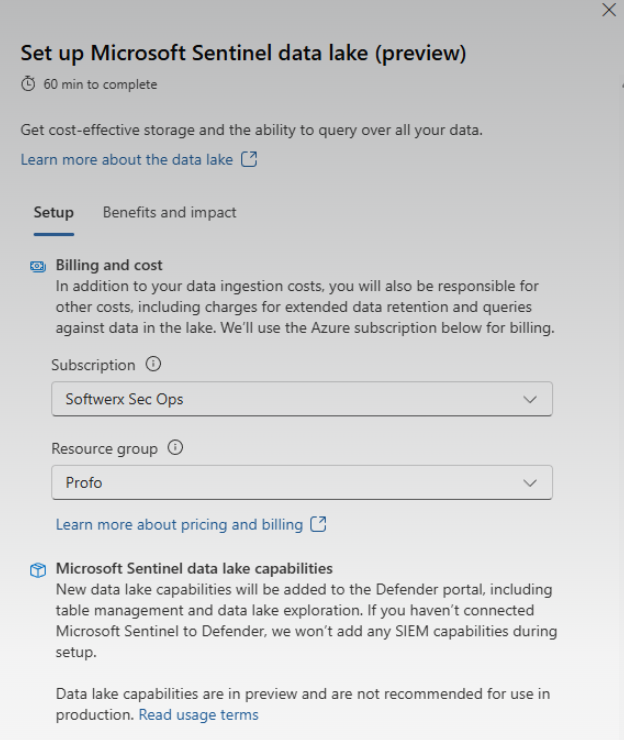
- Tell Microsoft Where to Send the Bill: The wizard will ask you to select an Azure Subscription and a Resource Group. You are simply telling Microsoft which subscription to bill for the service.
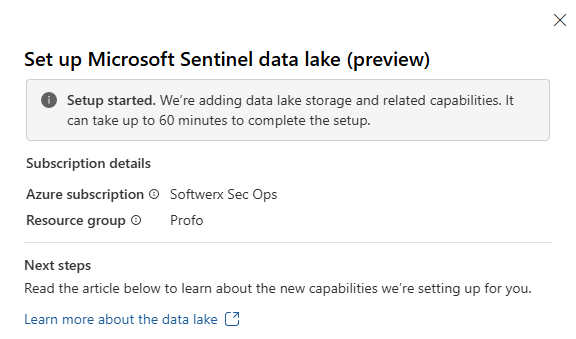
- Confirm and Wait: After you've selected your billing details, click Set up data lake. The process can take up to an hour.
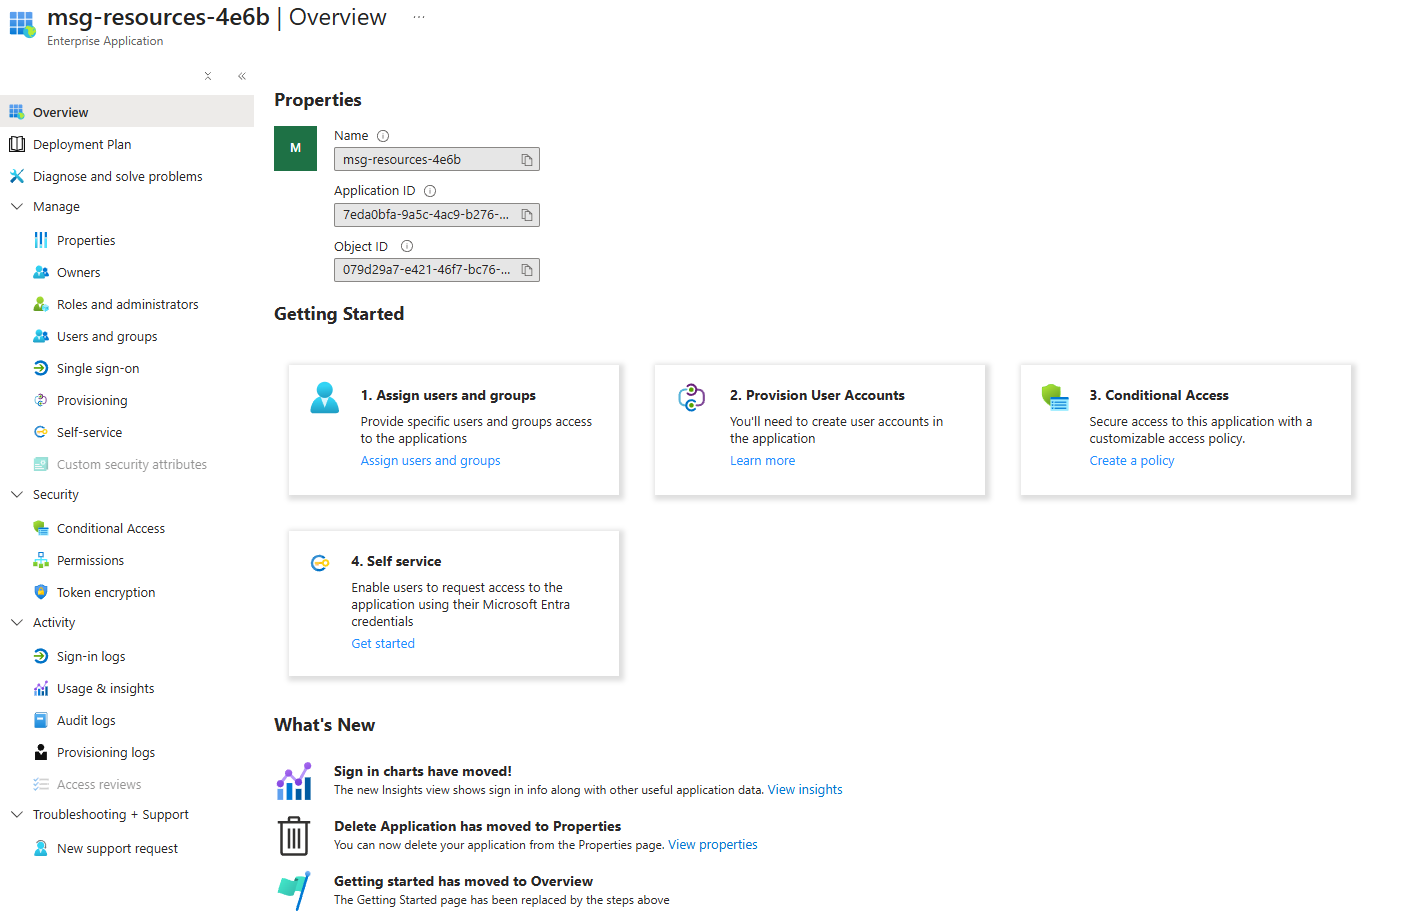
Once Data Lake integration is created, you may see a new managed identity added to your environment. Do not delete it as it's required to keep the Data Lake flow.
Controlling the Flow: Managing Your Tables
Once the lake is set up, you need to tell Sentinel what to do with your data. By default, you won't notice too many changes.
- In the Defender portal, go to Microsoft Sentinel> Configuration > Tables.
- Find a noisy, high-volume table you want to manage, like
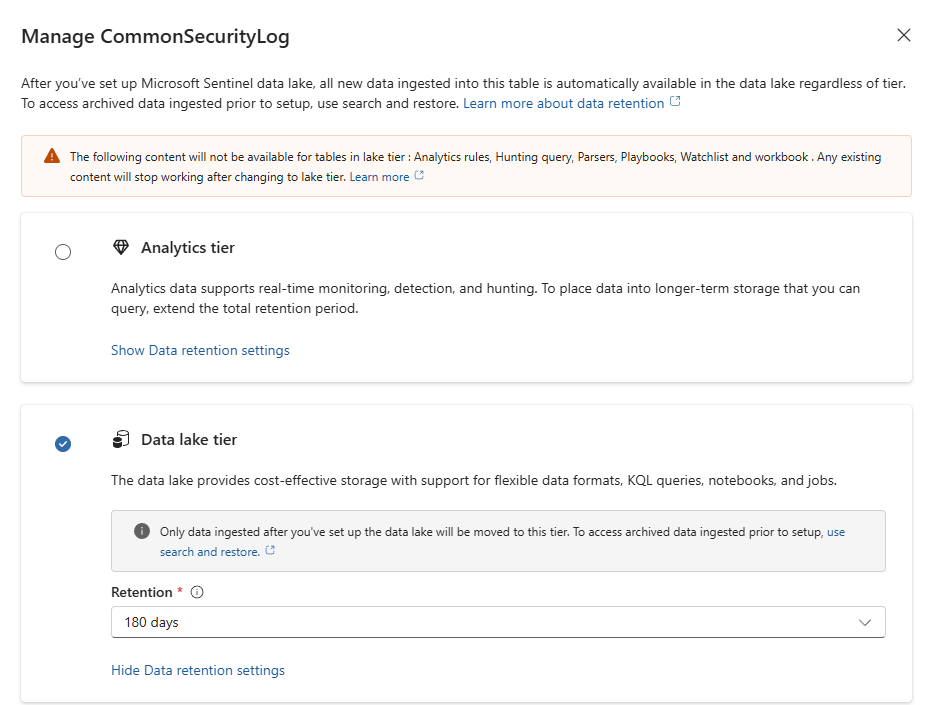
Syslog. Click on it to open the management pane. - You now have two powerful choices:
- Option A (Default - Mirroring): Keep the data in the Analytics Tier for its initial retention (e.g., 90 days) and extend the Total Retention up to 12 years (this will be stored in Data Lake)
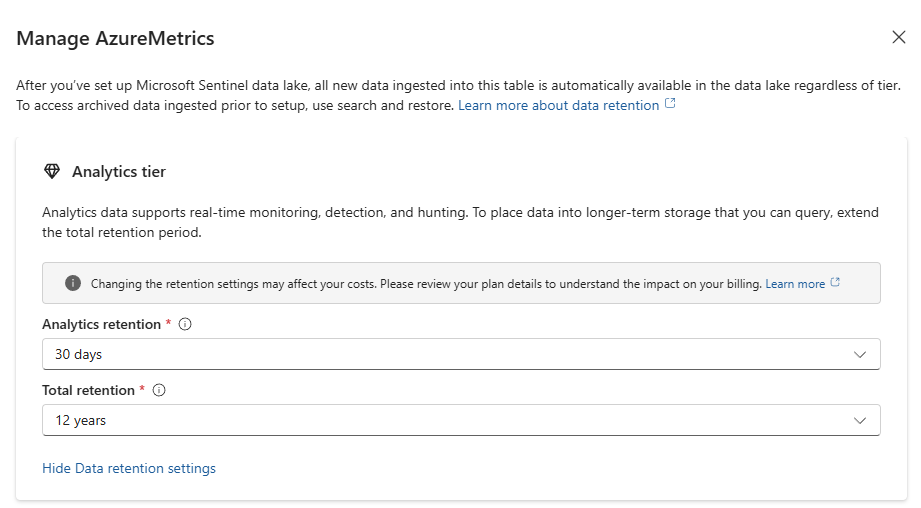
- Option B (Cost-Saver - Lake Only): Change the Tier dropdown to Data lake tier. New data for this table will now skip the Analytics tier and go straight to the Data Lake.
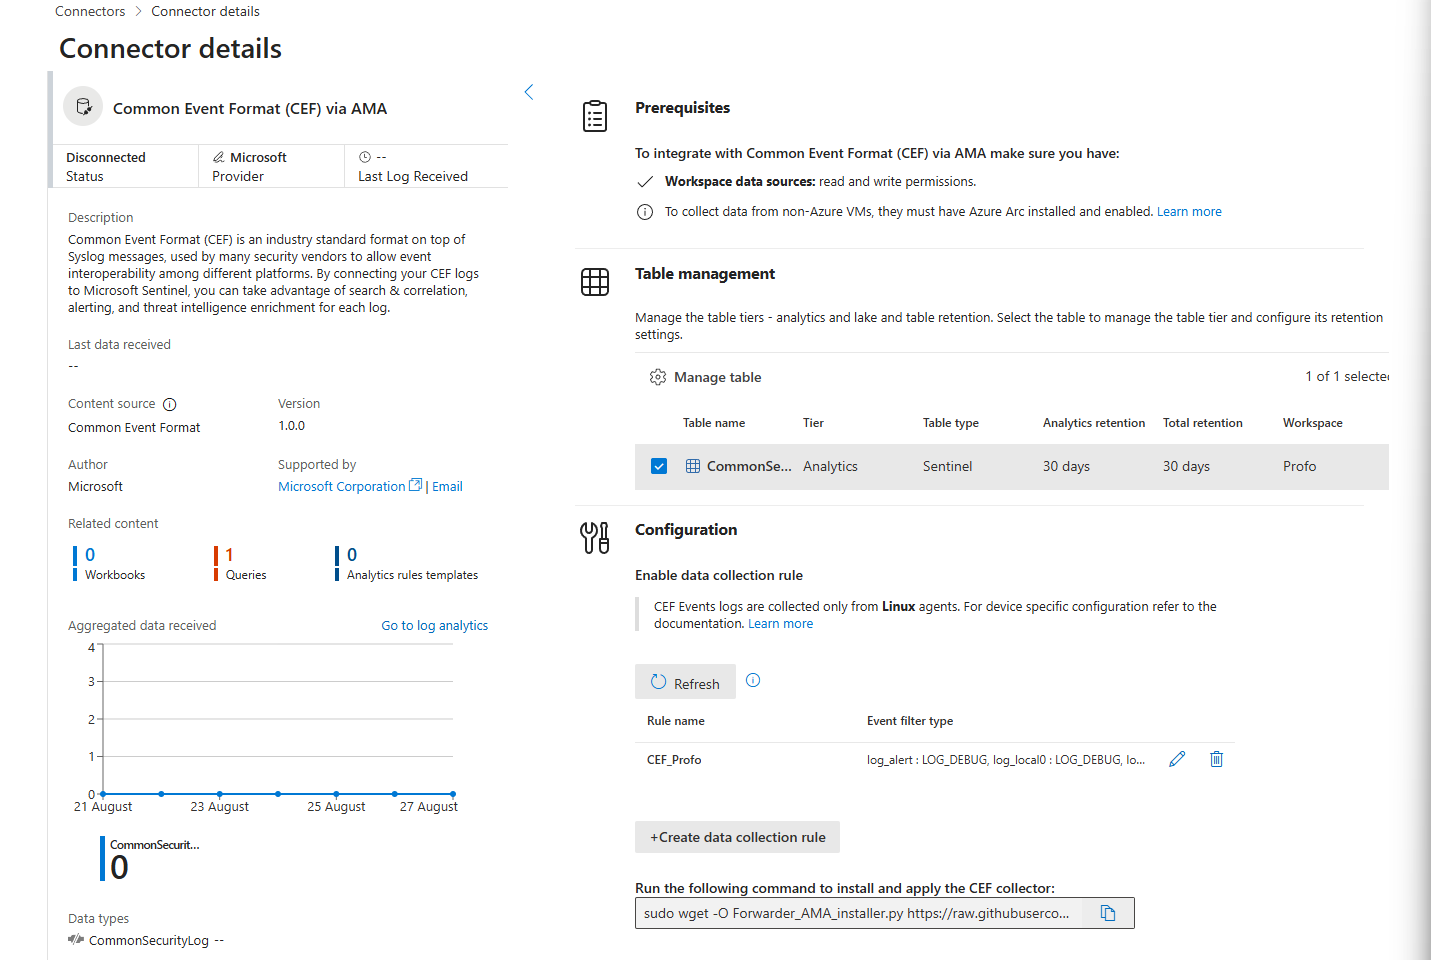
Data Connectors Refreshed
When checking data connectors in the new Unified Portal, you will quickly realise that they look different - tables can now be managed directly from the connector page. Even though the number of connectors is currently limited, this is a sweet change!
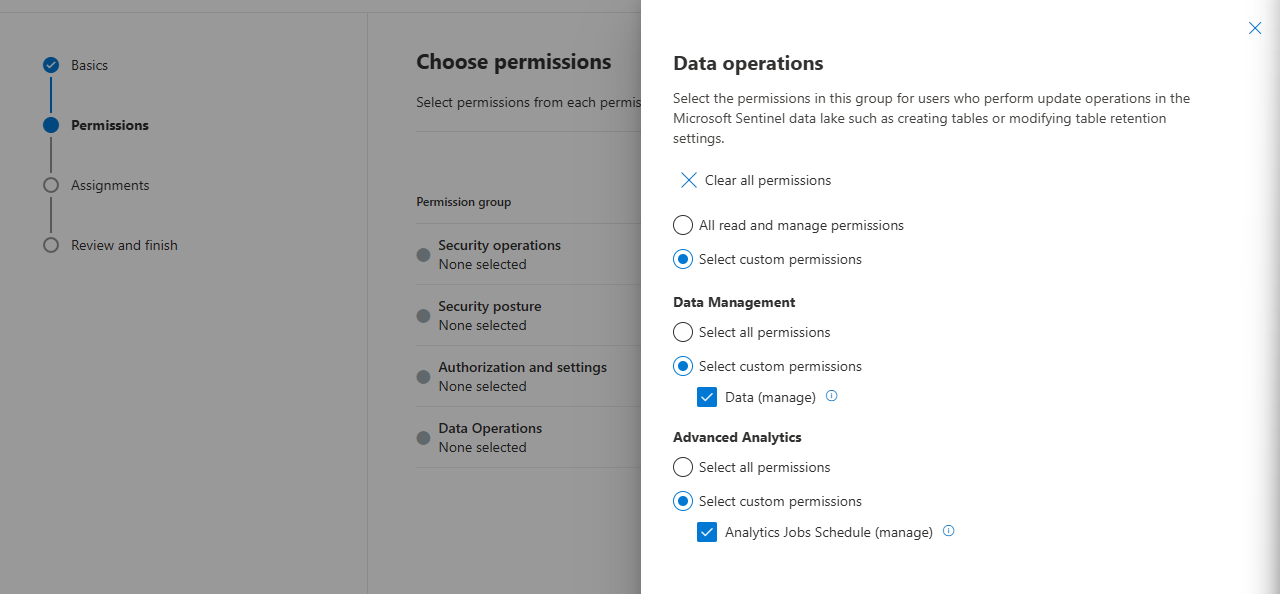
Access Control: Permissions to Control
Sentinel Data Lake is fully integrated with Unified RBAC, which adds a layer of protection so only specific groups or users can make any changes to the Data Lake.
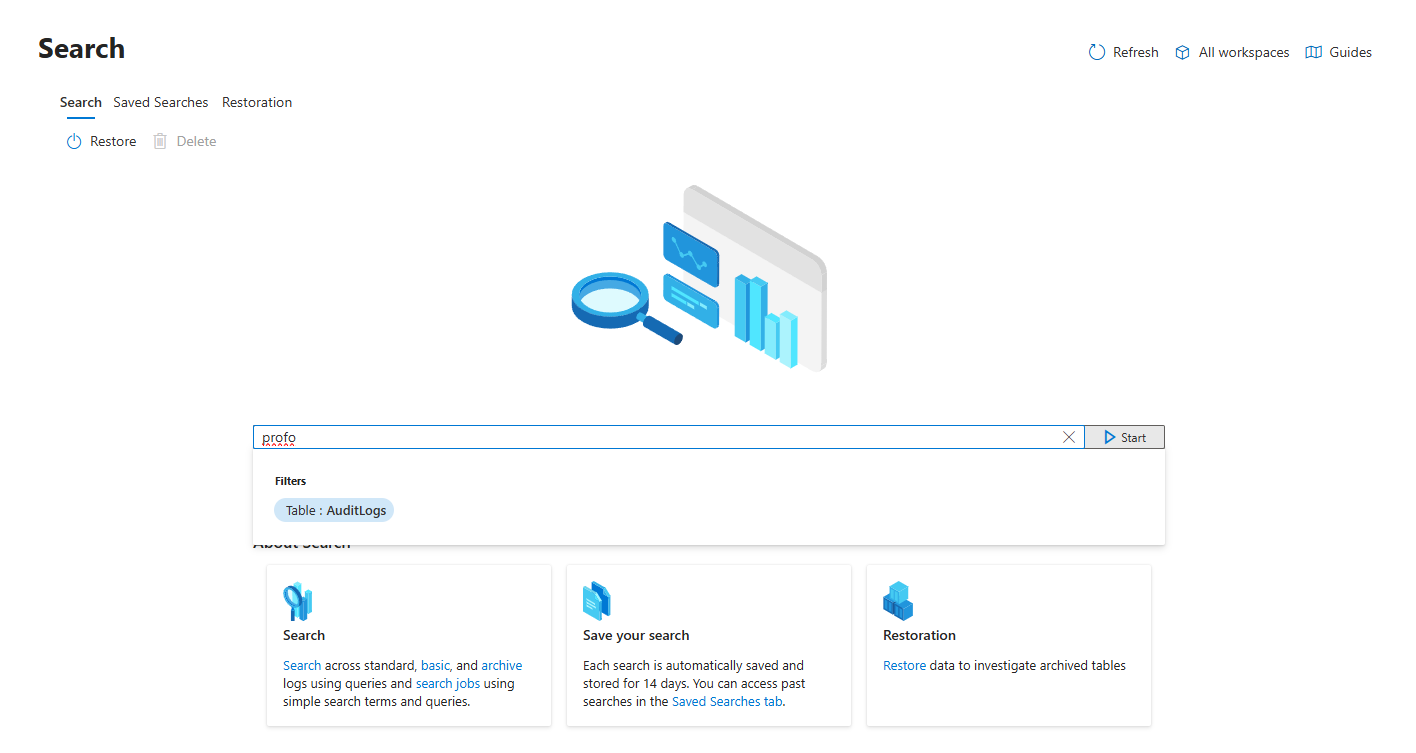
Search EVERYTHING
Neat option - search by keyword is available in Data Lake exploration
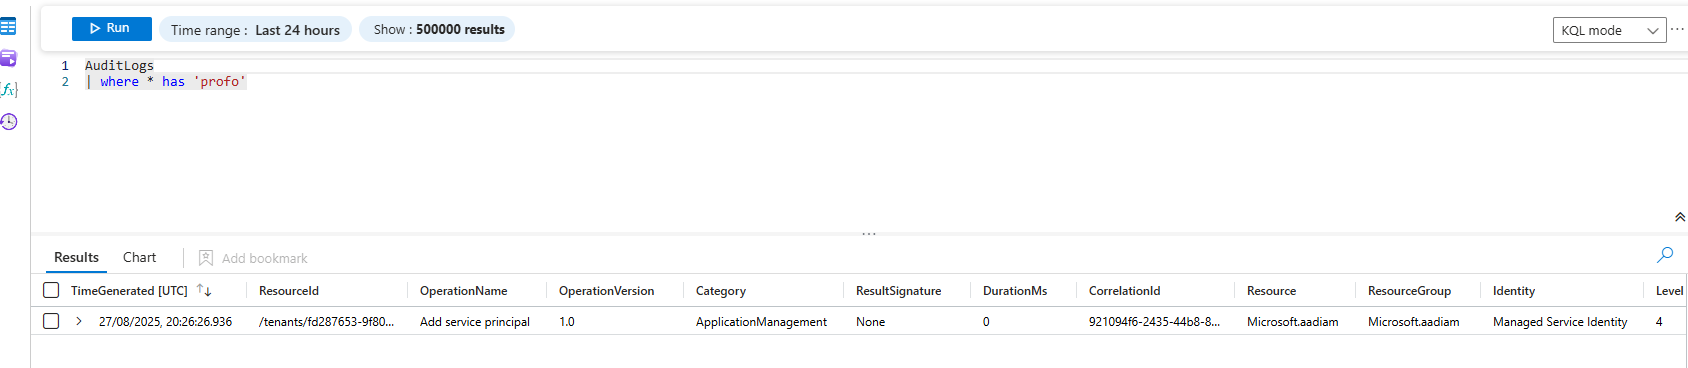
Let's say I want to look up profo against a specific table, in this case AuditLogs, i just need to type it in and click on the start
After a second, we are redirected to the log analytics workspace, where we can see the results. This will be useful whenever testing new analytic rules or running queries against multiple workspaces.
KQL Jobs vs Summary Rules vs Search Jobs
When it comes to handling data in the new Microsoft Sentinel Data Lake, not all queries are created equal:
KQL Jobs - Deep Dive Mode
Think of these as your “big-brain” queries. Run them on years of historical data, join multiple tables, or prep low-touch logs for the Analytics tier. Perfect for forensic investigations or complex enrichments. They can be scheduled daily, weekly, or monthly.
Summary Rules - Your Daily Pulse
Lightweight, fast, and efficient. Summary rules aggregate trends from a single table and refresh as often as every 20 minutes. Great for monitoring spikes or creating dashboards without dragging the entire cold dataset.
Search Jobs - One-Off Excavations
Need to pull a huge chunk of cold data into Analytics for a deep dive? Search jobs hydrate single-table datasets for one-time investigations. Think of it as your forensic rescue lane.
Professor’s TL;DR (Aka “When to Use What?”)
| Scenario | Use | Why |
|---|---|---|
| Query historic, multi-table data over long periods | KQL jobs | Full KQL, up to 12-year lookback, scheduled or ad-hoc |
| Track frequent trends or spikes from a single log type | Summary rules | Quick (~20-min), lightweight aggregates for alerts/dashboards |
| Bulk-migrate data into Analytics for deep one-time review | Search jobs | Long-running, supports big backfills from one table |
Giving Your Robot Its Orders
A KQL job is a "fire and forget" task. You give it the hard work, it goes off into the background, and it brings you back the results when it's done.
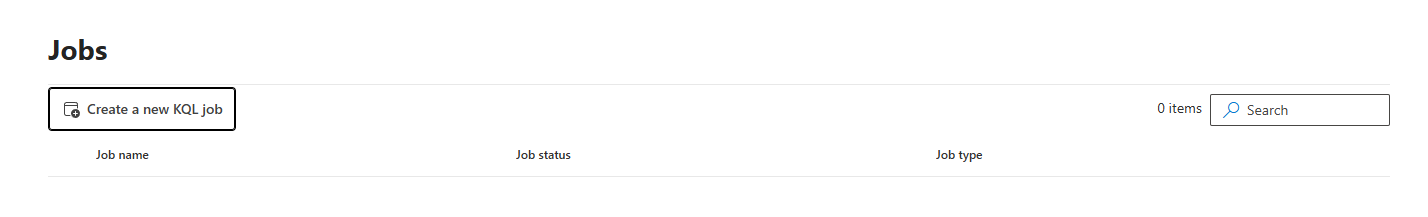
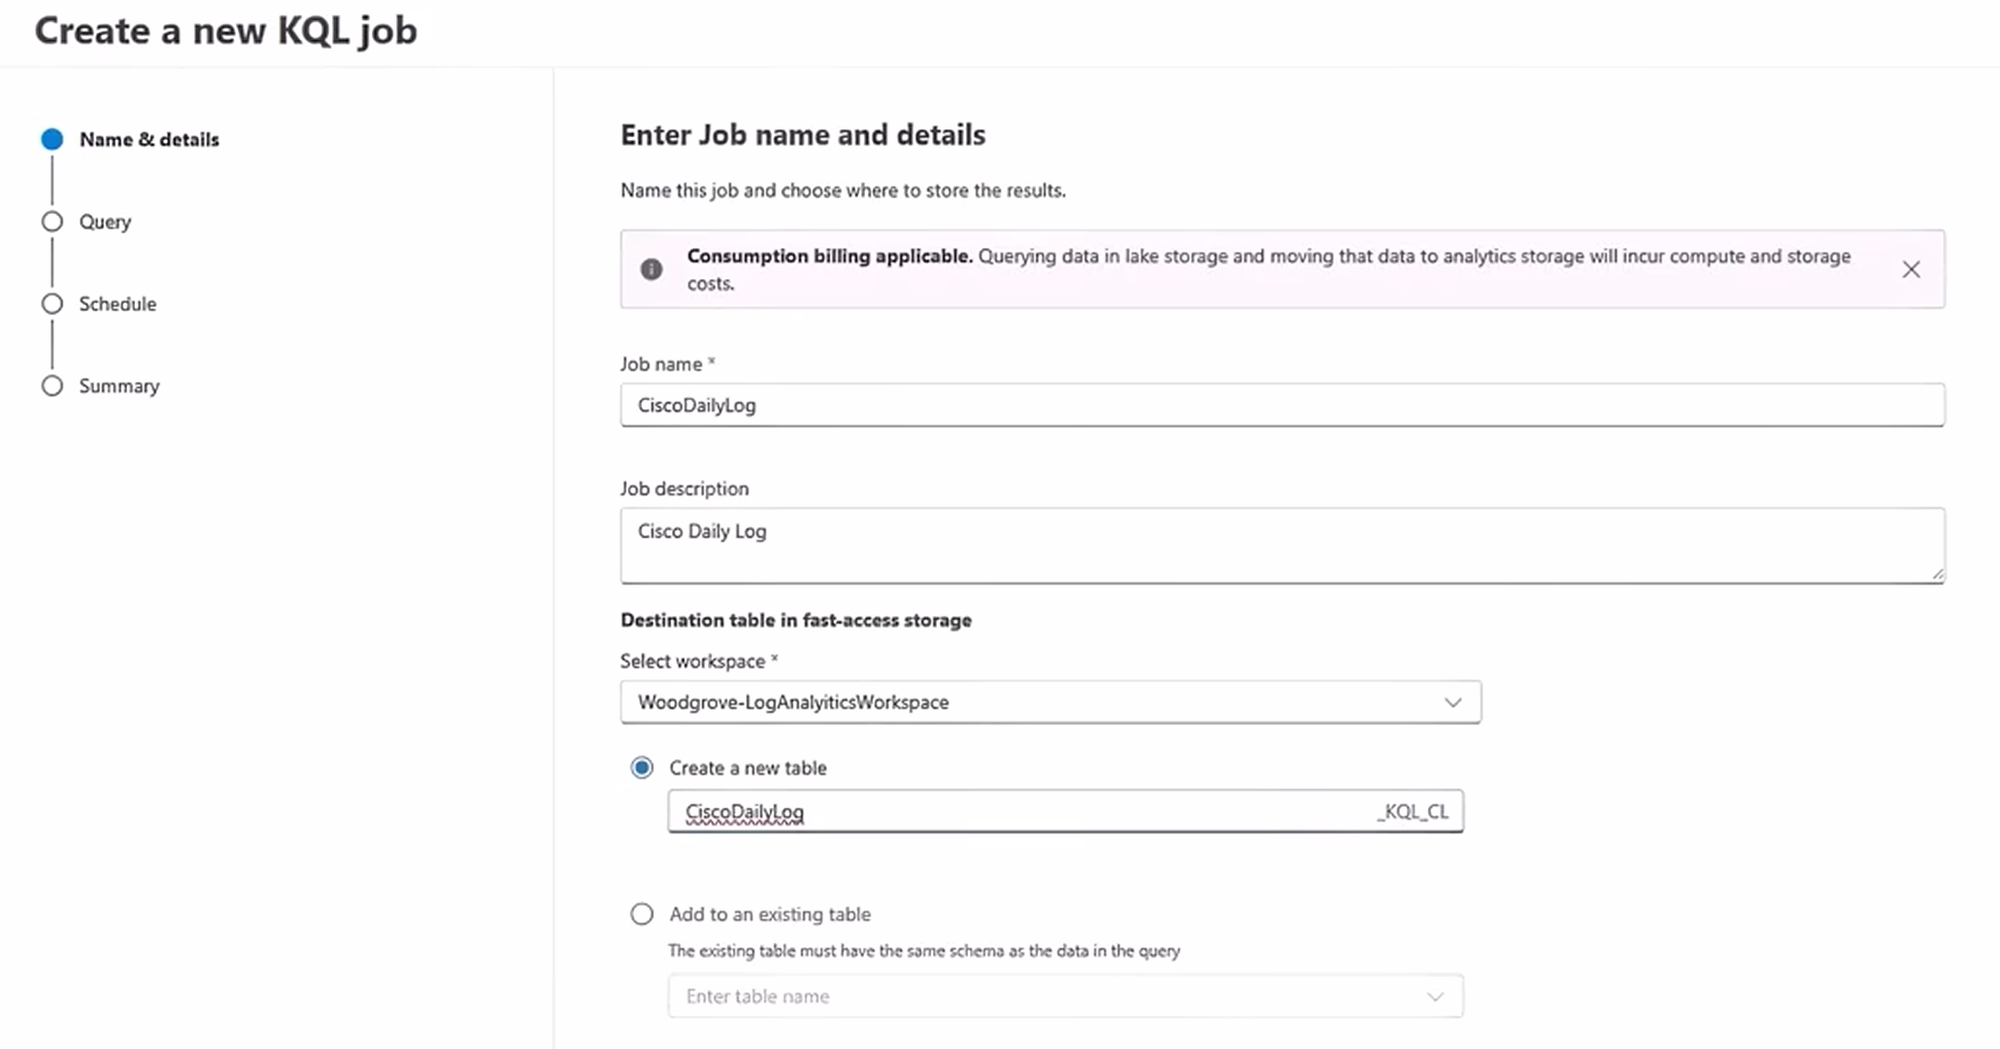
You'll navigate to Data lake exploration > Jobs in the Defender portal and click + Create a new KQL job
The most important part is the Destination table. You tell the job to put its findings into a brand new, "hot" table in your Analytics tier. In this case, we’ll call it CiscoDailyLog. The system will add _KQL_CL to the end, creating:
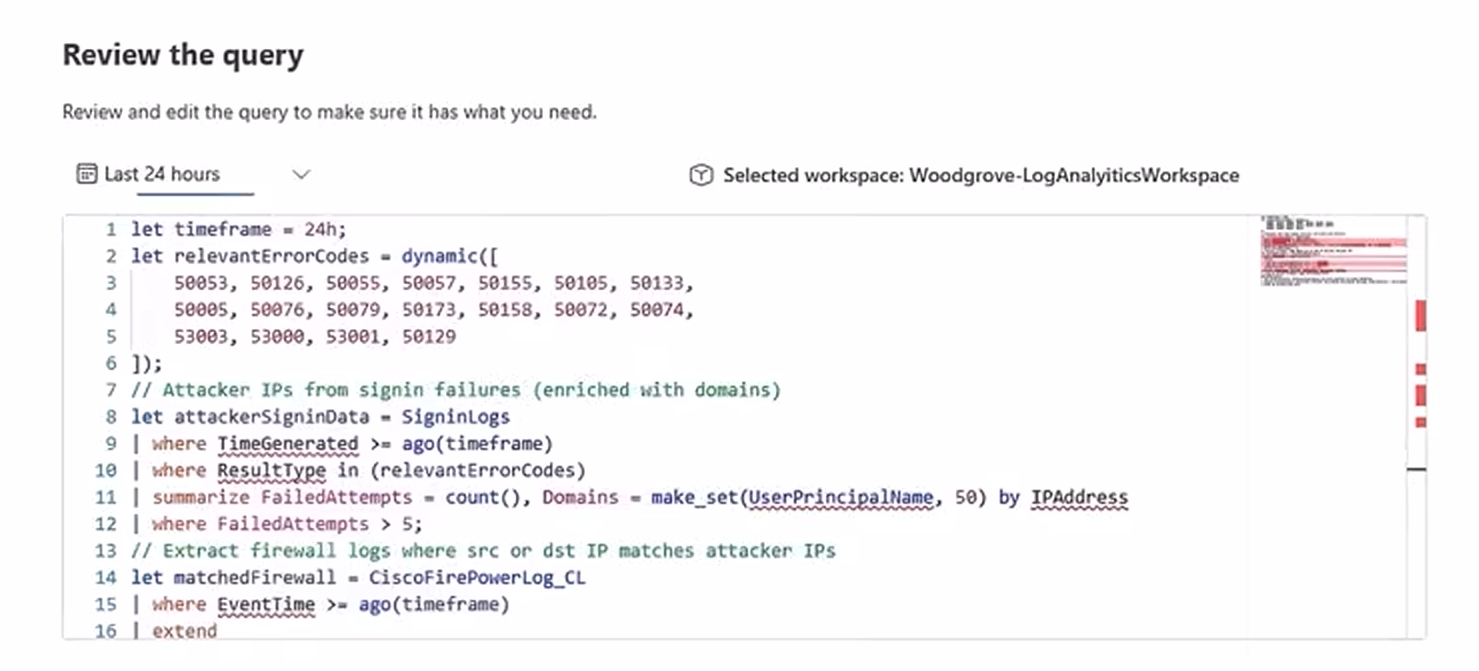
Here, you give it the heavy-lifting query. For example, this one looks for attacker IPs from sign-in failures and matches them against Cisco firewall logs:
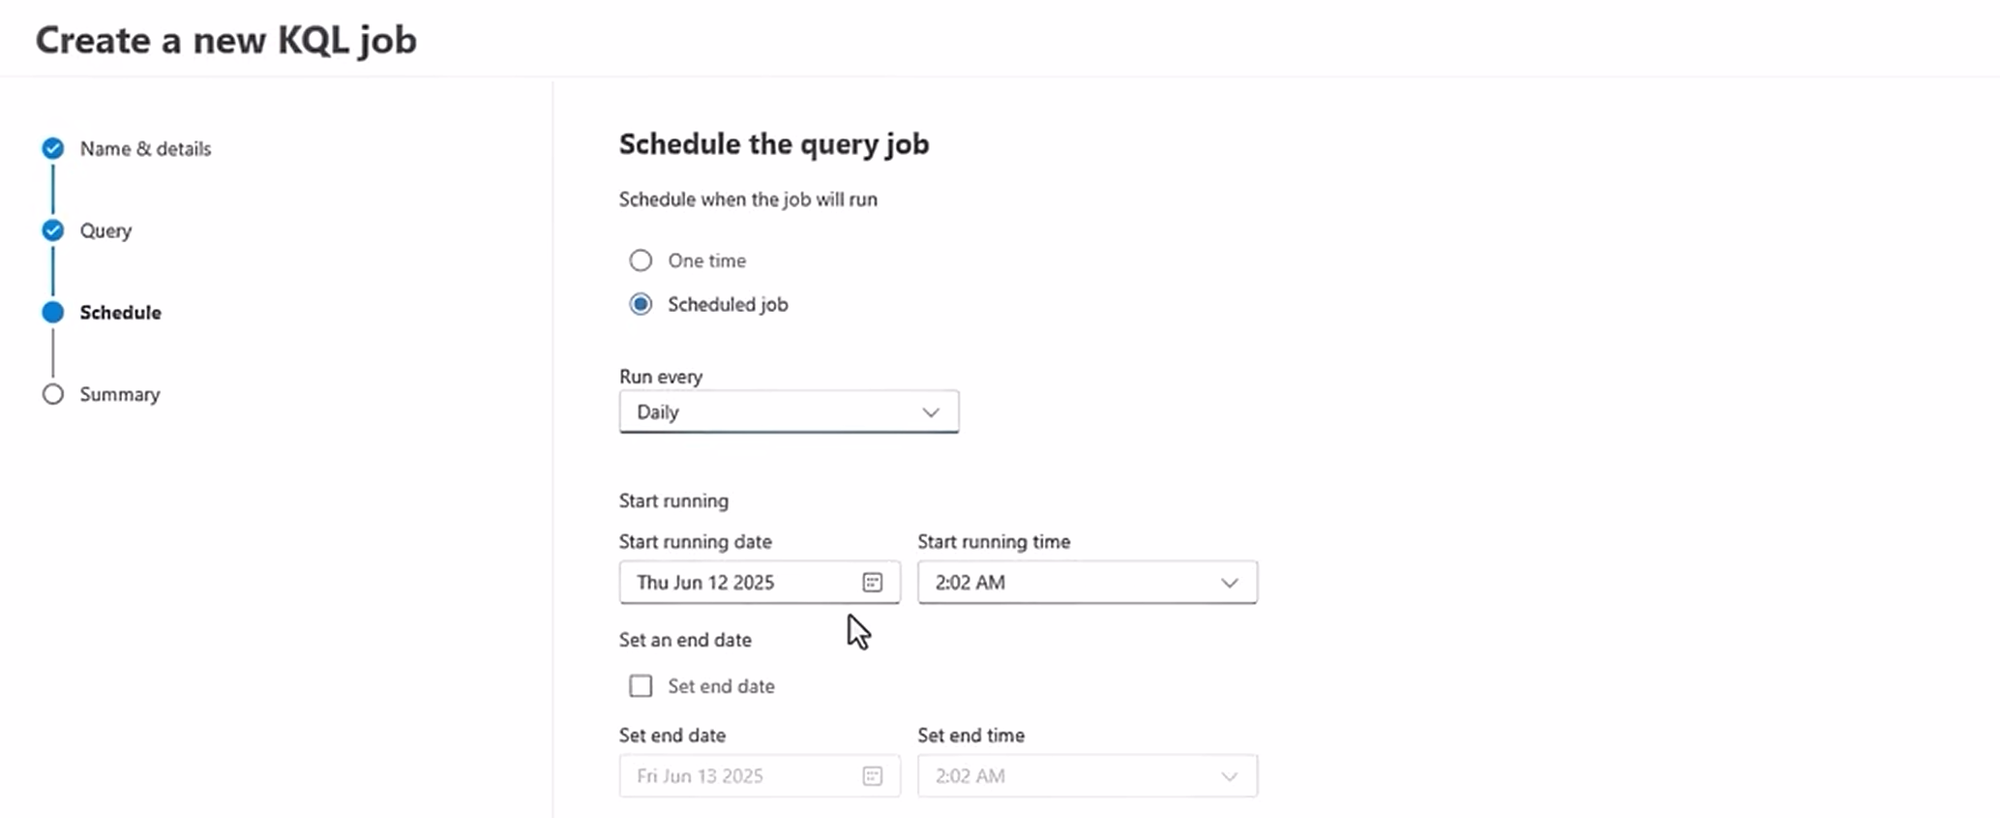
Once scheduled, you click “Create,” and your robot assistant is now dutifully chugging away. Go grab a coffee.
Analysing the Loot
Once the job status shows "Completed," the fun begins. Your robot has returned with a small, clean, pre-summarised table that you can now query quickly.
Now you go back to the regular Logs blade. You're no longer querying the slow, cold lake; you're running lightning-fast queries against your new, custom-built summary table:
Example: show the top attacker IPs by failed sign-in attempts:
CiscoDailyLog_KQL_CL
| summarize TotalFailedAttempts = sum(FailedAttempts) by IPAddress
| top 5 by TotalFailedAttempts
Or show a timeline of a specific attacker IP:
CiscoDailyLog_KQL_CL
| where IPAddress == "203.0.113.50"
| summarize FailedAttempts = sum(FailedAttempts) by bin(TimeGenerated, 1h)
| render timechart title="Failed sign-ins from 203.0.113.50"
You paste the beautiful chart into the Teams chat, and your manager thinks you're a KQL god. You just turned an impossible, time-out-prone query into a two-step process that looks effortless.
That is the entire point: you use the Data Lake KQL job for the slow, heavy, boring work, then use normal, fast queries on the smart results for your actual high-speed investigation.
Class dismissed.