Microsoft Sentinel: From Logs to Alerts - Creating Your First Analytic Rule

Welcome back, class! In our last lesson, we successfully turned on the data firehose with Data Connectors. Your Sentinel instance is now collecting logs, which is a fantastic first step. But let's be honest: right now, it’s just a very well-organised, very expensive digital filing cabinet.
Data on its own doesn't really provide security. Insight does. Today, we’re going to build the engine that creates that insight. We’re creating our first Analytic Rule.
This is the pivotal moment where we transition from passively collecting data to actively hunting for threats. We're about to teach Sentinel what to look for, so it can be the vigilant security guard you hired it to be.
So, grab a coffee. A strong one. You’re about to see how the sausage is made.

What is an Analytic Rule, Really?
You can find plenty of complex definitions out there. Let's break it down into the two explanations that actually matter.
The "Architect's Definition":
An Analytic Rule is a scheduled correlation query, written in KQL, that runs against ingested log data at set intervals. When a pattern of events matching the rule's logic is detected, it generates an enriched security alert and can trigger automated response workflows, thus operationalizing your detection strategy.
The "In-the-Trenches" Explanation:
Imagine Sentinel is watching hundreds of security camera feeds (your logs). An Analytic Rule is you giving the guard a clear, simple instruction:
"Every five minutes, check if someone unlocks the front door and, in the next second, also unlocks the back door. If you see that happen, I need you to create a detailed report and put it on my desk immediately."
That instruction is the rule. The KQL is how you write it. The report on your desk is the Alert it creates.
Rule Templates: Microsoft's Gift to Busy Analysts
Starting from a blank slate is tough. Thankfully, Microsoft provides a fantastic head start with Rule templates.
Navigate to Sentinel > Analytics. The "Rule templates" tab is a library of pre-built detections crafted by Microsoft's own security experts. The number of templates available to you is directly tied to the Data Connectors you've enabled. Connect Entra ID, and you get identity-based rules. Connect your firewall, and you get network-based rules.
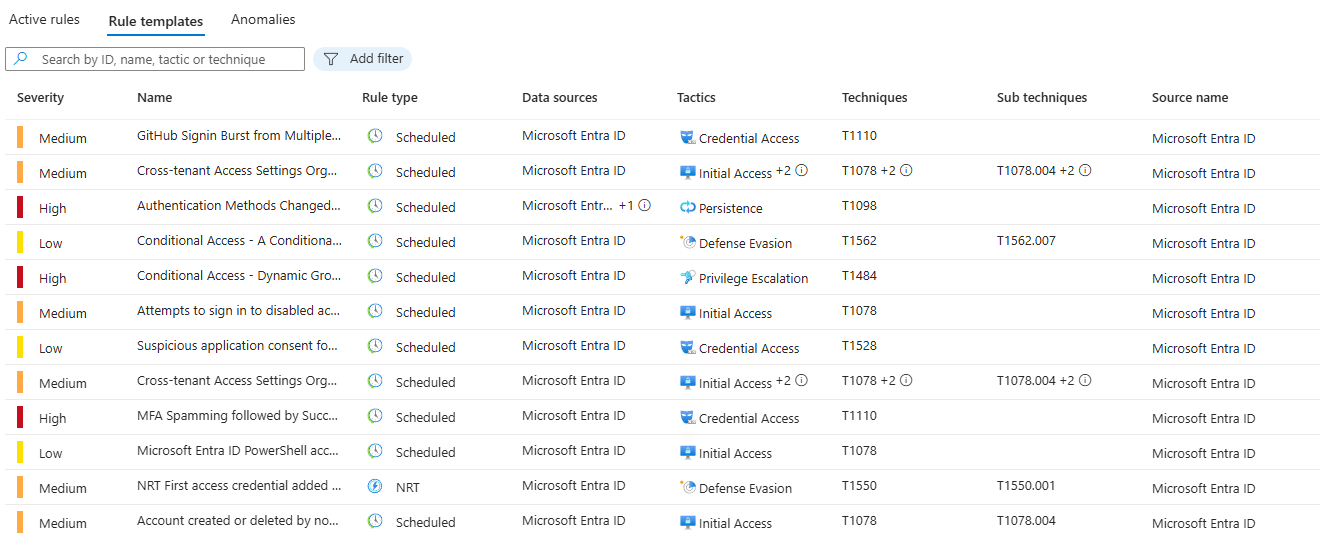
Professor's Pro Tip: Make it a habit: whenever you deploy a new Data Connector, your very next stop should be this tab. See what new, pre-built detections you can deploy. It's the most efficient way to immediately increase your detection coverage.
Creating Our First Rule: The "Impossible Traveller" Detection
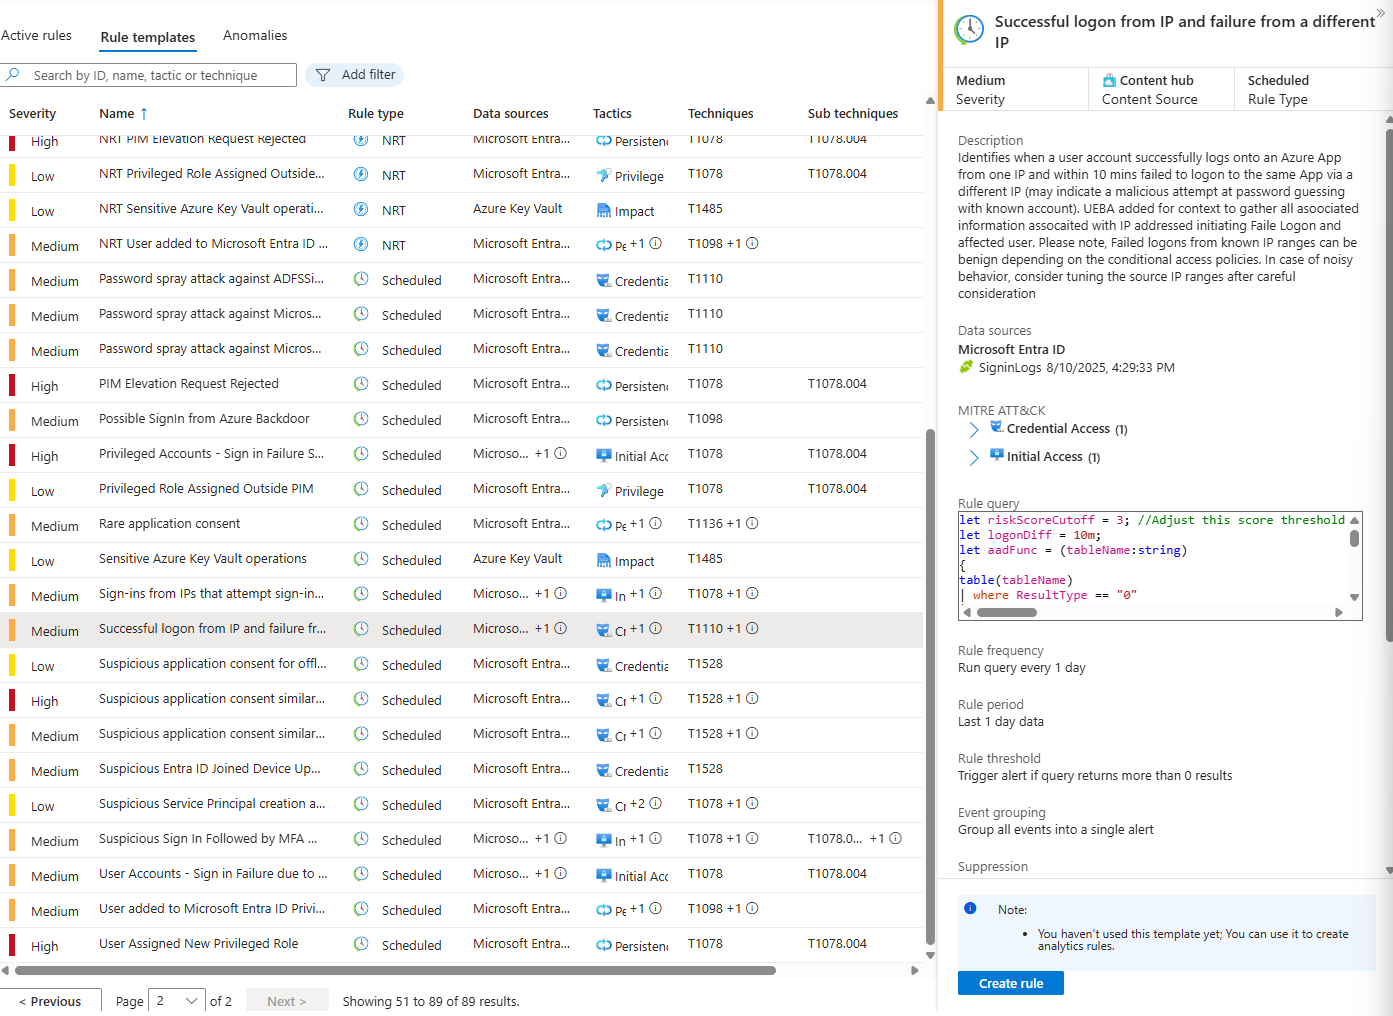
Let's start with a high-value, classic detection. In the templates, search for "Successful logon from new IP and failure from a different IP." This rule is designed to catch "impossible travel" scenarios (at the top of multiple other rules and Identity Protection), a strong indicator of a compromised account.
Select the template and click "Create rule" to launch the setup wizard.
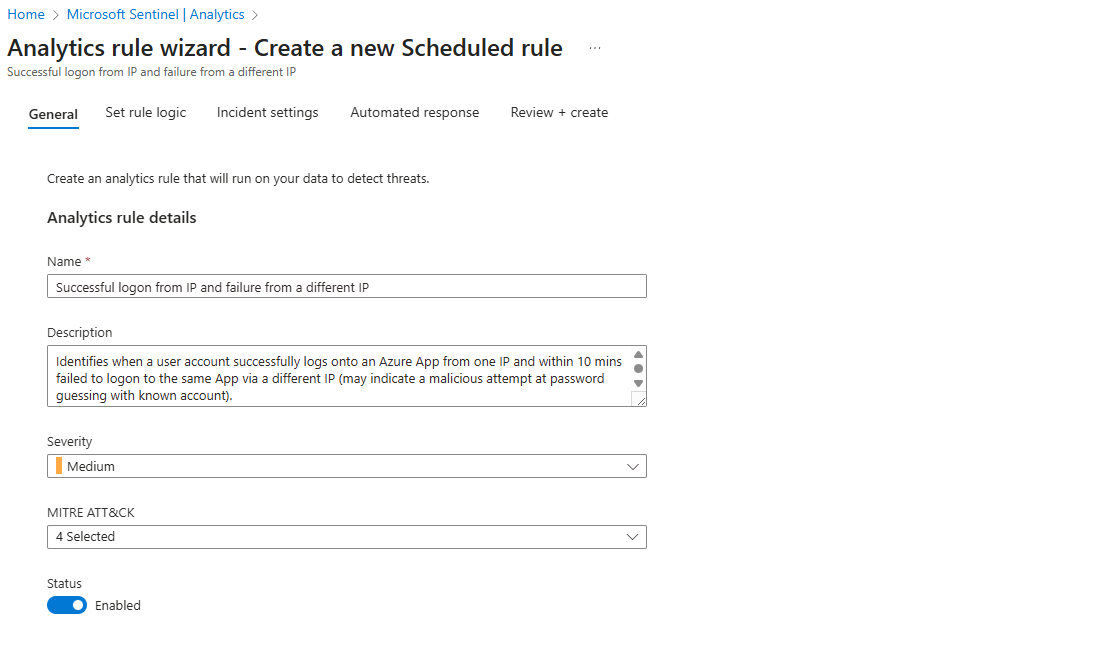
Step 1: The General Tab (The Basics)
This page covers the rule's identity: its Name, Description, Severity, and mapping to the MITRE ATT&CK framework. The default values here are generally very well-configured, but you can of course modify them further. Dwelling into the right framework tactic may be too soon for you, and there is nothing wrong with using default values. You can see this rule is already mapped to the "Initial Access" and "Brute Force" tactics. For now, let's trust the defaults, ensure the rule is Enabled, and move on.
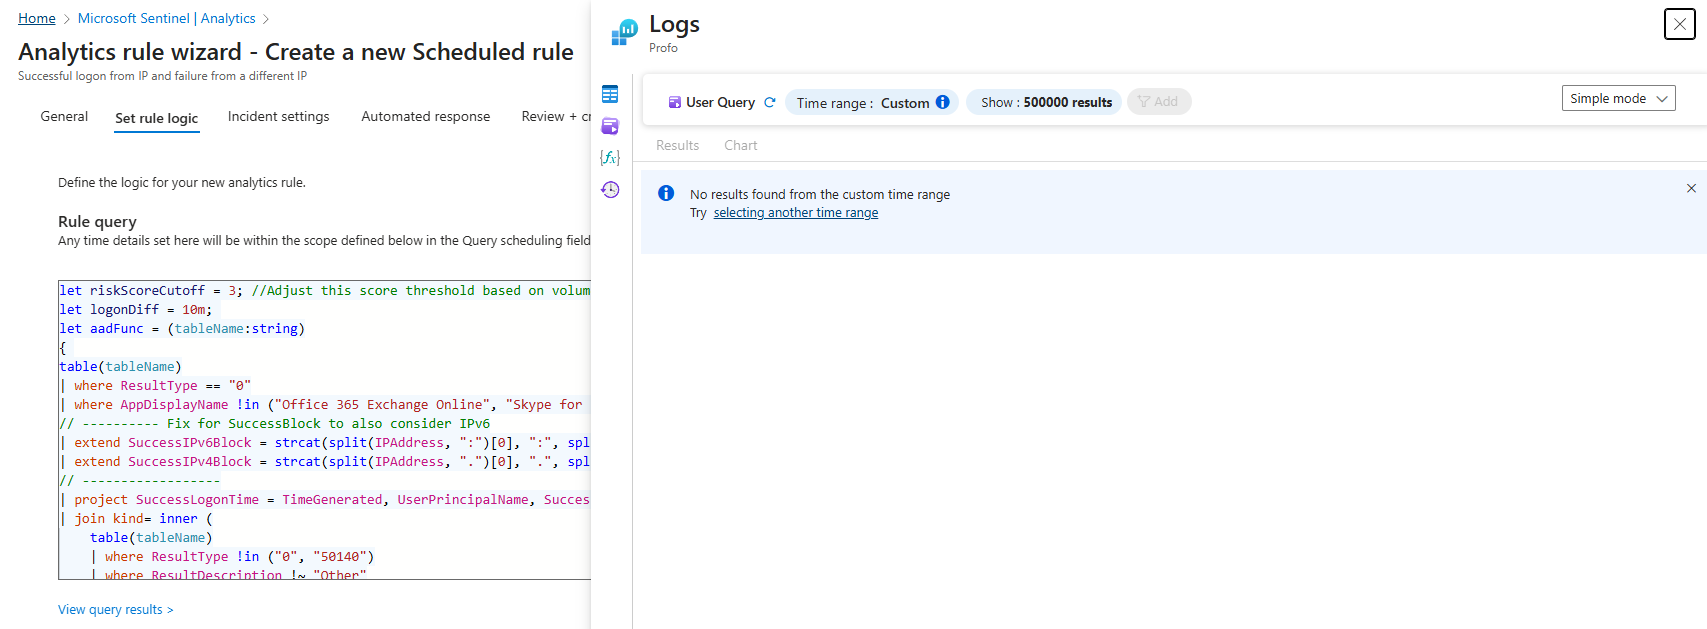
Step 2: Set Rule Logic (The Engine Room)
This is the most important part of the process. This tab contains the Rule query—the KQL code that serves as the brain of your detection.
The most useful feature here is the "View query results" button. Clicking this will run the query against your recent data. This is your "validation check."
- If it returns a high number of results: The rule might be too "noisy" for your environment and may need tuning (ideally before pushing this live, just test it first with applied changes)
- If it returns zero results: Excellent. This means the rule is well-calibrated and will only trigger when a truly anomalous event occurs (still test it though, as it may mean that rule doesn't work at all. Wouldn't be the first time with Microsoft default rules)
Next is Alert enrichment. Taking a moment here will save you hours later.
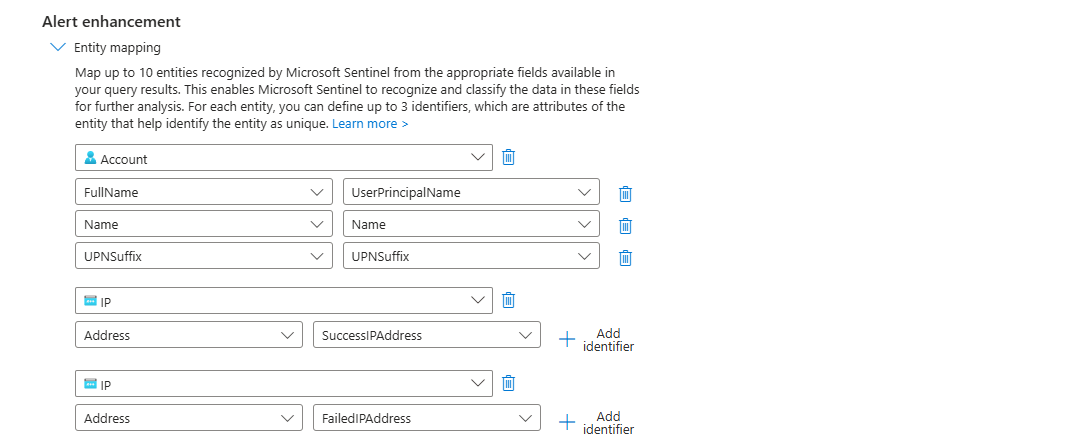
- Entity mapping: This is essential. It's how you tell Sentinel which data points are the key actors in the story—the
UPN, theIP address, etc. Proper entity mapping is what powers the investigation graph and enables effective automation, and you should always try to surface as much information as you can. Especially when creating custom analytic rules.
Alert details (and Custom details): This feature lets you create dynamic, informative alert titles. Instead of a generic title, you can format it to be immediately useful:
Successful logon from IP and failure from a different IP for User: {{AccountCustomEntity}}
This simple step gives an analyst critical context before they even open the incident. Really neat feature, surprisingly rarely used.
Step 3: Query Scheduling & Threshold
These settings define the rule's timing. The Alert threshold is key. Setting it to "is greater than 0" ensures that you are alerted to the very first instance of suspicious activity, which is almost always what you want.
Query scheduling, on the other hand, will give you a fantastic opportunity to scan the data from a number of days prior to the alert, in most of the cases for Microsoft "Rule templates" this option isn't as important, but once you will deep dive into custom KQL/Analytic rules you will see the importance of creating a data sets that can compare user activity and create a baseline/threshold based on it.
Don't worry, Profo is going to show you that soon enough!

Step 4: Incident Settings (The Sanity-Saver)
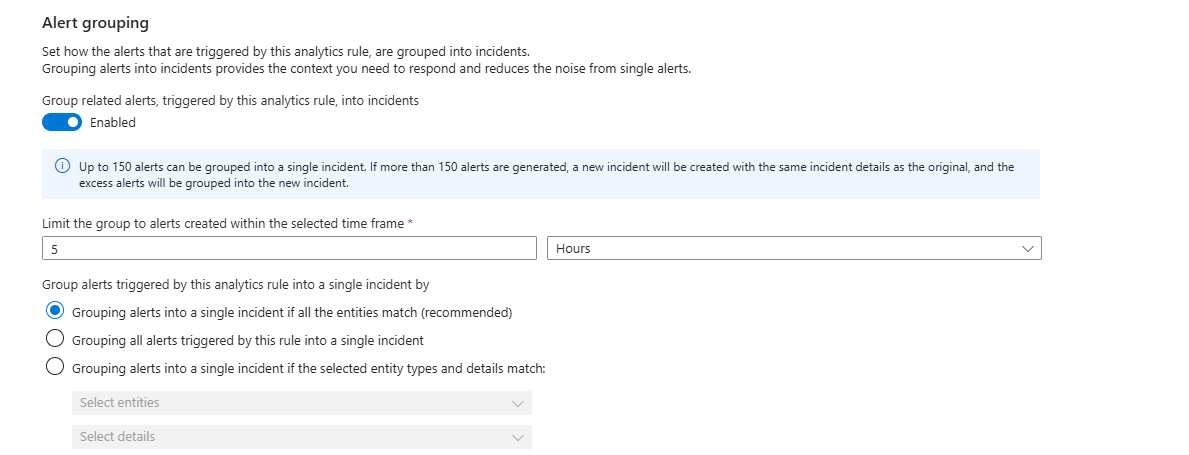
There is a toggle here: "Group related alerts into incidents." I strongly recommend you enable this.
If you don't, a single ongoing attack could generate dozens of individual alerts, flooding your queue. This feature groups them into one manageable incident, allowing your team to see the whole picture instead of being overwhelmed by noise.
Step 5: Automated Response (The Future is Now)
This is where you can connect your rule to a Logic App playbook to trigger an automated action—like sending a Teams message, disabling an account, or blocking an IP. We won't configure one today, but it's important to know that this is where the "SOAR" magic happens.
Review and Create: Activate Your Detection
Click through the final steps, review your configuration, and click "Create."
And that's it! Your new rule is now live in the "Active rules" tab. It's a silent guardian, continuously analysing your data for the specific pattern you defined.
You've successfully moved from data collection to active detection. You've given Sentinel its first mission. Now, go enjoy that coffee—you've earned it.
