The KQL Playbook (Play #4): The Correlation Play - Joining Tables and Enriching Data

Alright, class. Take your seats.
In our last play, we made you into data janitors of the highest order. You took on the messy, chaotic world of raw logs, and you won. You can now wield parse like a scalpel to extract intel from ugly strings, use bin to visualise attack timelines, and unpack the cryptic treasure chests of nested JSON with mv-expand. You’re no longer intimidated by the format of the data; you can bend it to your will.
But you've started to notice a new, more frustrating problem.
You've found a definitive piece of evidence. A successful sign-in from a user, but from a completely unexpected country, was logged in the SigninLogs table. You have the user, the IP address, and a timestamp. You feel the thrill of the hunt. But this single log is a dead end. It’s one piece of a much larger puzzle.
What did that user do after they authenticated? What actions did the device they logged into perform immediately after? Did they access sensitive files? Change permissions?
The answers aren't in your SigninLogs entry. They are scattered across other tables: AuditLogs, DeviceEvents, and CloudAppEvents. Your evidence is isolated. To understand the full story of the attack, you need to connect the dots.
Today, we graduate from data janitors to intelligence analysts. We’re moving beyond cleaning a single crime scene to connecting multiple crime scenes across the entire city. This is the art of correlation. I am going to teach you how to use let statements to organise your investigation and the mighty join operator to weave disparate log sources into a single, coherent narrative.
📚 The Complete KQL Playbook Series
You're reading part of The KQL Playbook, a comprehensive five-part journey from KQL beginner to threat-hunting professional. Whether you're just starting out or levelling up your detection skills, each play builds on the last.
The Five Plays:
Play #1: A Beginner's Guide to Talking to Your Data
The pipe (|), where, summarize, project, and sort by. The foundational moves that turn a blank query window into your first real conversations with data.
Play #2: Mastering the Matching Game
The difference between == and =~, when to use has vs. contains, and why one wrong character can blind your entire detection strategy.
Play #3: Taming Messy Dataparse, extract, split, bin, and mv-expand. Your toolbox for wrestling chaotic strings, timestamps, and JSON objects into submission.
Play #4: The Correlation Play: Joining Tables and Enriching Data
Master let, join, and the art of connecting disparate log sources to build complete narratives of attacker movement.
Play #5: The Anomaly Play: Finding the 'Weird'make_set, set_difference, and arg_max. Your weapons for hunting threats you don't already know about.
Jump to Your Level:
Beginner? Start with Play #1
Getting zero results? Play #2 has the answer
Drowning in messy data? Play #3 fixes that
Need to correlate events? Play #4
Ready to hunt anomalies? Play #5
Remember: Don't try to memorise syntax. Master the mindset. Every complex query is just these fundamentals chained together with pipes.
Storing Your Intel: The Power of let
Before you can correlate data, you need to be organised. In any major investigation, you'll have key pieces of intelligence: a malicious IP address, a compromised user account, a suspicious file hash. You'll need to use these pieces of intel over and over again to query different tables.
A rookie analyst copies and pastes. They run a query on SigninLogs with the user's name, then they copy the same name into a new query for AuditLogs, then again for CloudAppEvents. It’s slow, it’s sloppy, and it’s a recipe for mistakes.
A professional uses variables. In KQL, our variables are called let statements.
Scenario: "An alert suggests a user account may be compromised. Where have we seen them?"
You've been given the User Principal Name (UPN) professor@softwerx.cloud, who has triggered a "travel from atypical location" alert. You need to quickly build a timeline of everything this user has done.
The Play: Define Once, Use Everywhere with let
The let statement allows you to define a name for a value. You define it once at the top of your query, and then you can refer to it by name as many times as you need.
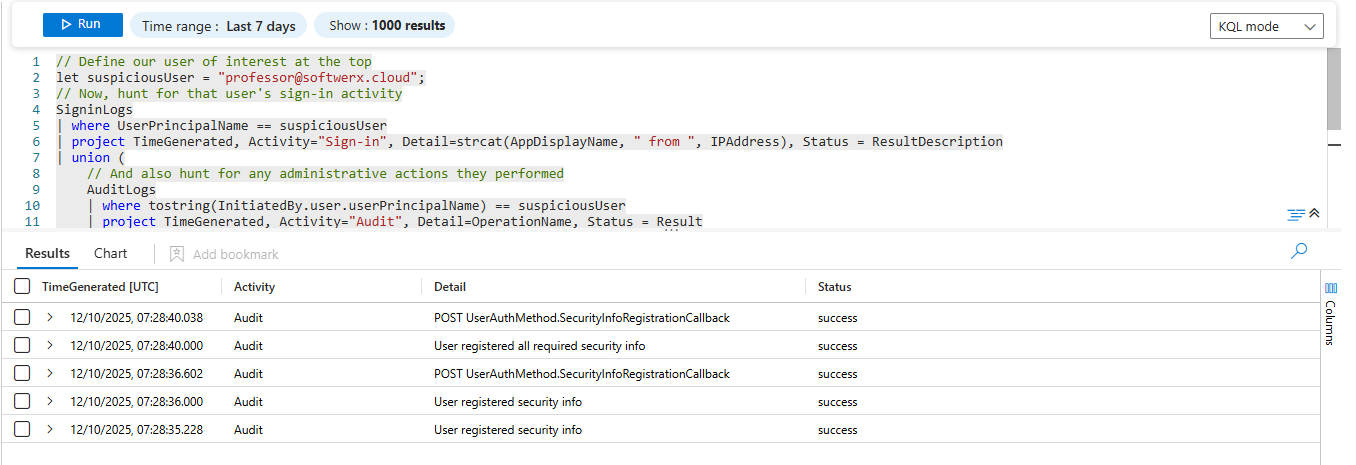
// Define our user of interest at the top
let suspiciousUser = "professor@softwerx.cloud";
// Now, hunt for that user's sign-in activity
SigninLogs
| where UserPrincipalName == suspiciousUser
| project TimeGenerated, Activity="Sign-in", Detail=strcat(AppDisplayName, " from ", IPAddress), Status = ResultDescription
| union (
    // And also hunt for any administrative actions they performed
    AuditLogs
    | where tostring(InitiatedBy.user.userPrincipalName) == suspiciousUser
    | project TimeGenerated, Activity="Audit", Detail=OperationName, Status = Result
)
| order by TimeGenerated desc
Let's break down this professional workflow:
let suspiciousUser = "professor@softwerx.cloud";: We assign the UPN to a variable namedsuspiciousUser. It’s clean, it’s at the top, and if you need to investigate a different user, you only have to update it in one place.where UserPrincipalName == suspiciousUser: InSigninLogs, we can use the variable directly.where tostring(InitiatedBy.user.userPrincipalName) == suspiciousUser: InAuditLogs, the user's name is nested inside theInitiatedByJSON object. We use dot notation to get to it andtostring()to ensure KQL handles the data type correctly.union: We stitch the results from both tables into a single result set, giving us a unified timeline of all activity for that user.
This is more than just a convenience; it's the foundation for building complex, readable, and maintainable investigation queries.
Connecting the Dots: The join Operator
Now for the main event. The let statement helps us organise our intel; the join operator lets us use that intel to connect different datasets. The true power of join is to enrich an event with the critical context that it's missing, allowing you to tell a complete story.
We're going to walk through two professional grade examples. The first is a fundamental investigative technique, and the second is a targeted threat hunt.
Scenario: "What did a user do in the first 10 minutes after they logged in?"
This is the golden question. The moments immediately following a successful logon are the most critical. Is the user just opening Outlook, or are they immediately launching a shell, downloading a file from the internet, or installing a new package? The logon event itself doesn't know. The process events are known, but they lack the context of the logon. We must join them.
The Play: Building a User's Post-Logon Timeline
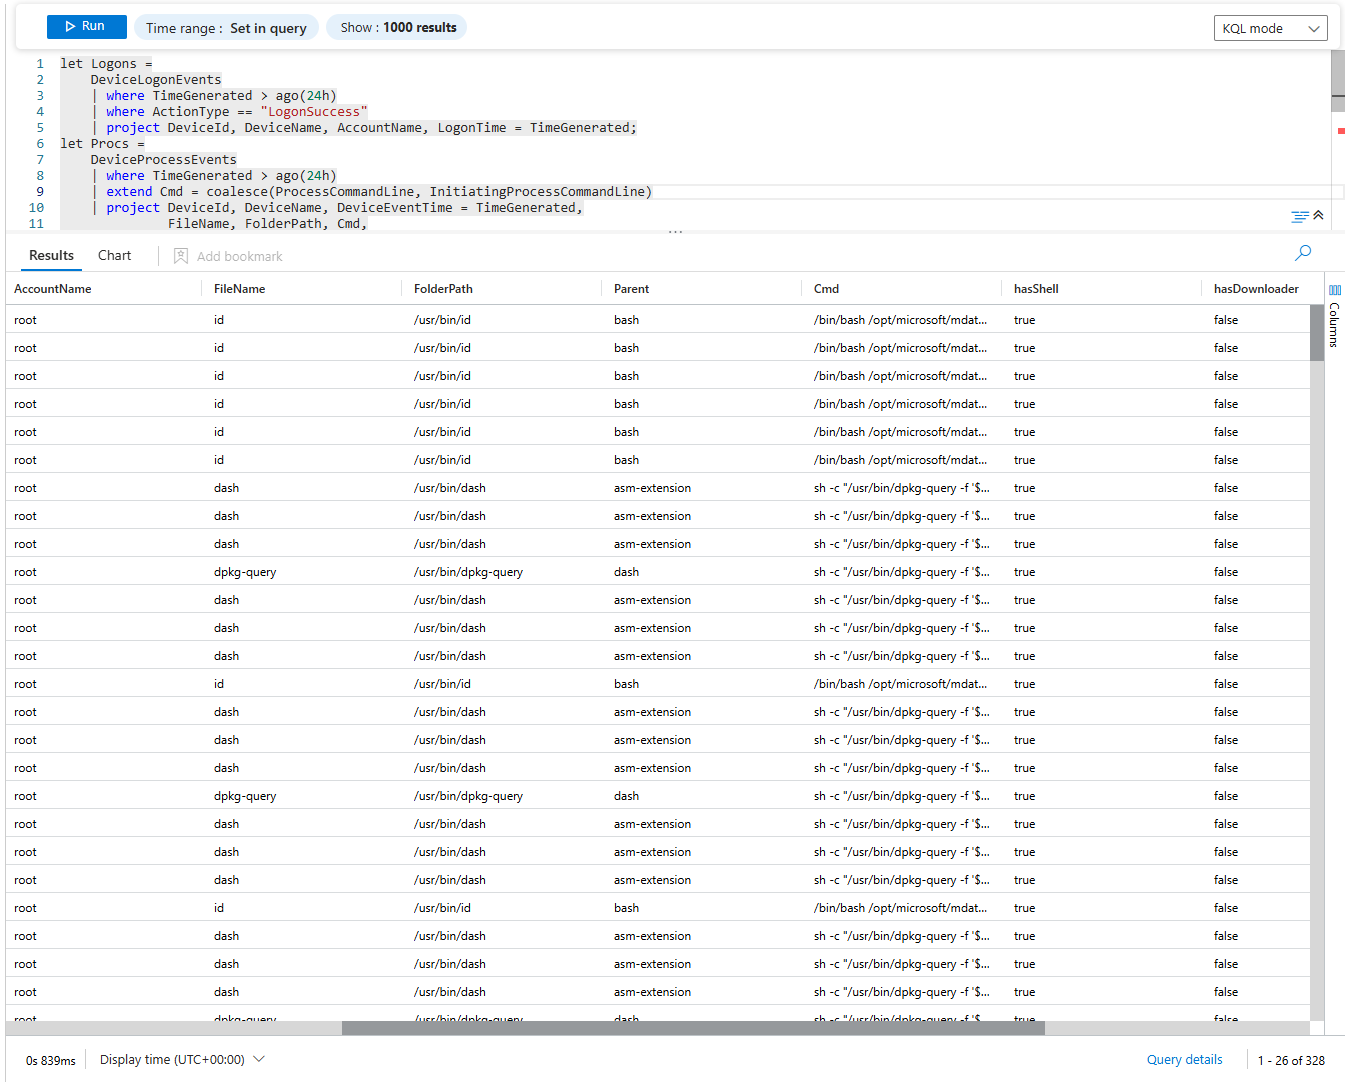
This query creates a clean, enriched timeline of every process that occurred within 10 minutes of a successful logon.
let Logons =
    DeviceLogonEvents
    | where TimeGenerated > ago(24h)
    | where ActionType == "LogonSuccess"
    | project DeviceId, DeviceName, AccountName, LogonTime = TimeGenerated;
let Procs =
    DeviceProcessEvents
    | where TimeGenerated > ago(24h)
    | extend Cmd = coalesce(ProcessCommandLine, InitiatingProcessCommandLine)
    | project DeviceId, DeviceName, DeviceEventTime = TimeGenerated,
              FileName, FolderPath, Cmd,
              Parent = coalesce(InitiatingProcessParentFileName, InitiatingProcessFileName);
Logons
| join kind=inner Procs on DeviceId
| where DeviceEventTime between (LogonTime .. LogonTime + 10m)
| extend hasShell      = Cmd matches regex @"(?i)\b(bash|sh)\s+-c\b"
| extend hasDownloader = Cmd matches regex @"(?i)\b(curl|wget)\b"
| extend hasPkgMgr     = Cmd matches regex @"(?i)\b(apt|yum|dnf|dpkg|rpm)\b"
| extend url           = extract(@"https?://[^\s'\""]+", 0, Cmd)
| project LogonTime, DeviceEventTime, DeviceName, AccountName,
          FileName, FolderPath, Parent, Cmd, hasShell, hasDownloader, hasPkgMgr, url
| order by LogonTime desc, DeviceEventTime asc
This is how a professional analyst starts an investigation. Let's break it down:
- Organise with
let: We create two temporary tables.Logonscontains all successful logons.Procscontains all process events. This keeps the logic clean and readable. - The
join: We joinLogonsandProcsonDeviceId. This is our stable key, linking every process to every logon that happened on the same machine. - The Time Correlation:
where DeviceEventTime between (LogonTime .. LogonTime + 10m)is the heart of the query. It filters the massive joined table down to only the processes that happened in the 10-minute window right after a logon. - The Enrichment: This is what makes the query powerful. The
extendblock doesn't just show data; it analyses it. It creates newtrue/falsecolumns that instantly flag if a command line contains a shell, a downloader, or a package manager. It even extracts any URLs it finds.
The result is a perfect timeline. You can see the user, the logon time, and then every single process they ran, with suspicious actions automatically flagged for your attention.
Hunting for Privilege Escalation
Now that you've mastered the basic correlation, let's use it to hunt for a specific attack. A common attacker technique on Linux is to gain initial access as a normal user and then exploit a vulnerability or misconfiguration to "escalate" their privileges to root.
A tell tale sign of this is a non-root, interactive logon immediately followed by a flurry of activity from the root account on the same machine. We can build a KQL query that looks for exactly this narrative.
The Play: Connecting a User Logon to Subsequent Root Activity
let FreshLogons =
    DeviceLogonEvents
    | where TimeGenerated > ago(24h)
    | where ActionType == "LogonSuccess"
    | extend Terminal = tostring(AdditionalFields.Terminal)
    | where Terminal != "cron" and AccountName != "root"
    | project DeviceId, DeviceName, User=AccountName, Terminal, LogonTime=TimeGenerated;
DeviceProcessEvents
| where TimeGenerated > ago(24h)
| where AccountName == "root"
| extend Cmd = coalesce(ProcessCommandLine, InitiatingProcessCommandLine)
| project DeviceId, DeviceEventTime=TimeGenerated, RootFile=FileName, RootCmd=Cmd
| join kind=inner FreshLogons on DeviceId
| where DeviceEventTime between (LogonTime .. LogonTime + 5m)
| project LogonTime, DeviceEventTime, DeviceName, User, Terminal, RootFile, RootCmd
| order by LogonTime desc, DeviceEventTime asc
Let's break down this hunt:
- Define the "Normal" Logon: The
FreshLogonsletstatement is precise. It looks for successful logons that are not from a scheduled task (Terminal != "cron") and not from the root user itself. This is our anchor: a real, non-privileged user session. - Define the "Suspicious" Activity: The main query looks at
DeviceProcessEventsbut only for processes where theAccountNameisroot. This is the activity we suspect is the result of an escalation. - The Join and Correlation: We
jointhe normal user's logon with the root user's process activity on the sameDeviceId. The time window is very tight:between (LogonTime .. LogonTime + 5m). This implies a direct cause-and-effect. The user logged in, and within five minutes,rootactivity began.
This query doesn't just show you logs. It tells you a story. It surfaces a high-fidelity list of potential privilege escalation events, showing you the exact user, the machine, and the root commands that were run immediately after they gained access.
The Final Play: Pivoting an Investigation
You've mastered joins for correlating events on a device over time. Now let's use the same operator for a different purpose: pivoting. Pivoting is the act of taking one known piece of data (like a malicious IP) and using it to discover unknown data (like the user accounts, and what else those accounts did across completely different log types).
Scenario: "An alert fired for a user signing in from a known malicious IP. What other suspicious activity is associated with that user?"
This is how you turn a single alert into a full-blown investigation. You don't just stop at the first sign-in. You assume the user account is compromised and begin hunting for everything else they've touched.
The Play: From One IP to a Full User Profile with let and join
// Step 1: Define our known bad IP
let suspiciousIP = "92.1.1.1";
// Step 2: Find all user accounts that have signed in from that bad IP.
// This is our list of potentially compromised accounts.
let compromisedUsers =
    SigninLogs
    | where IPAddress == suspiciousIP
    | distinct UserPrincipalName;
// Step 3: Now, pivot. Take that list of users and find ALL their sign-ins
// activity from ANY IP to build a profile of their behaviour.
SigninLogs
| where UserPrincipalName in (compromisedUsers)
| summarize LoggedInApps = make_set(AppDisplayName), IPs = make_set(IPAddress), Locations = make_set(tostring(LocationDetails.countryOrRegion)) by UserPrincipalName
// Step 4: Enrich this profile with any administrative actions they performed.
| join kind=leftouter (
    AuditLogs
    | where tostring(InitiatedBy.user.userPrincipalName) in (compromisedUsers)
    | summarize Operations = make_set(OperationName) by UserPrincipalName = tostring(InitiatedBy.user.userPrincipalName)
) on UserPrincipalName
| project UserPrincipalName, IPs, Locations, LoggedInApps, Operations
This is a full investigation in a single query. Let’s break down the strategy:
- Find the Lead: The
compromisedUsersletstatement creates our initial list of suspects. It's a simple query that finds every distinct user who has ever come from oursuspiciousIP. - Pull the Thread: The main query starts with
SigninLogs. We find all sign-in activity for our suspects. We thensummarizethis data to build a profile for each user, creating lists of all IPs, locations, and applications they've used. - Enrich and Expand: We then
joinour user profile with theAuditLogs. The link ison UserPrincipalName. This adds a final, crucial piece of context: a list of all administrativeOperationsperformed by each compromised user. - Build the Profile: The final
projectgives you a complete intelligence summary for each compromised user: all the IPs and locations they've used, all the applications they've accessed, and any administrative changes they've made.
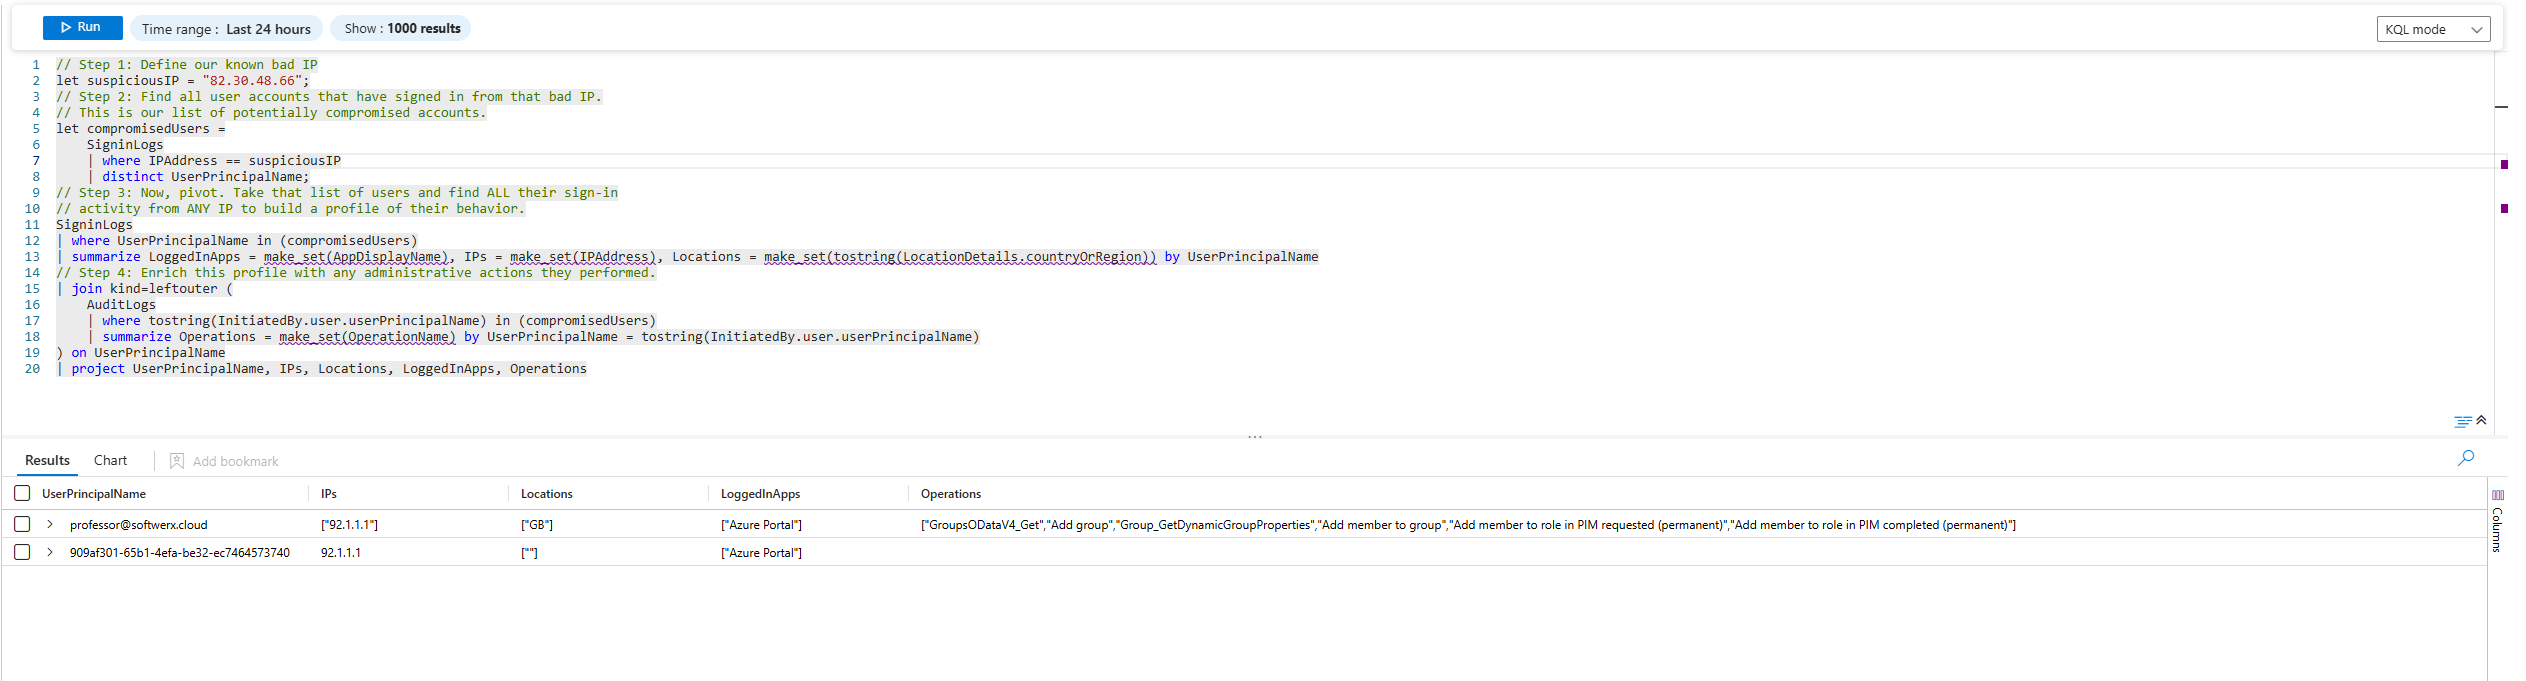
You started with a single IP address and, through the power of correlation, you have constructed a rich profile of attacker activity. You've answered not just "what happened?" but "who did it, where did they come from, and what did they do next?"
That is the difference between a log reviewer and a threat hunter.
Class dismissed.